
Macroeconomy
6 min Read
13 Nov, 2026
Share On



This US macroeconomic report covers data released November 2–10, 2026. Releases include ISM manufacturing and services PMIs, October payrolls, October CPI and the September trade balance. Together, these releases show expanding factory activity, firm core inflation and a trade deficit driven by record imports. For investment bankers, research teams, PE/VC sponsors and credit analysts, the prints shape rate expectations, financing costs and exit timing. Moreover, the data follow the prior edition’s Federal Reserve hold. They now raise the question of whether a December hike returns to the table.
October 2026 data point to an economy with expanding activity, sticky inflation and a hawkish Federal Reserve backdrop. The ISM Manufacturing PMI rose to 55.5, a tenth straight month of expansion, while the Services PMI eased to 54.5 as New Orders slid to 55.9 from 59.8. Consumer prices rose 0.4% after 0.6% in September, with core CPI at 0.3% for a third consecutive month. However, the latest annual headline rate, 3.7% for September, was not updated because October 2025 data are missing.
Labor markets surprised: payrolls grew 165,000, September was revised up to 60,000, and unemployment dipped to 4.1%. Even so, involuntary part-time work rose 339,000 and U-6 reached 7.9%. The September trade deficit stood at $105.0 billion, with record imports of $426.6 billion fueled by AI-related capital goods demand. Market-implied odds now stand close to 80% for a December 8–9 rate hike. Investors should watch October trade data on December 8 and November CPI on December 10. They should also track whether manufacturing strength and elevated input prices keep core inflation firm.
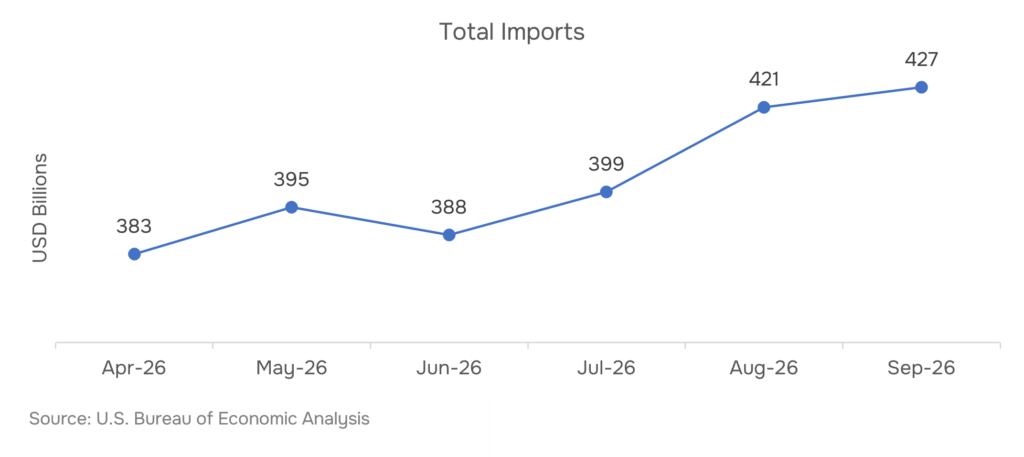
The ISM Manufacturing PMI, released November 2, 2026, climbed to 55.5 in October from 54.5 in September. Notably, the sector logged a tenth consecutive month of expansion after ten months of contraction. The reading also beat the 54.5 consensus. Five of the six largest manufacturing industries expanded.
Domestic demand posted its strongest pace in five years, while robust consumer spending and AI-related capital investment supported activity. Meanwhile, the Employment Index eased to 52.4 from 52.7. The Prices Index fell to 75.2 from 77.9, reflecting higher costs linked to the prolonged Iran war. In addition, S&P Global’s manufacturing PMI registered 54.9, below September’s 52-month high of 55.9.
The ISM Services PMI, released November 4, 2026, eased to 54.5 from 54.9. However, Business Activity fell 2.7 points to 53.8, and New Orders dropped 3.9 points to 55.9 from 59.8. Employment improved 1.3 points to 51.4, the Backlog of Orders rose to 58.0 from 56.6, and the Prices Index slipped to 73.0 from 74.0. The divergence shows manufacturing gaining cyclical leadership while services demand normalizes, sustaining inflation risk for Federal Reserve policymakers and global investors tracking US macroeconomic data. Investors modelling industrial earnings can track these inputs through market intelligence frameworks.
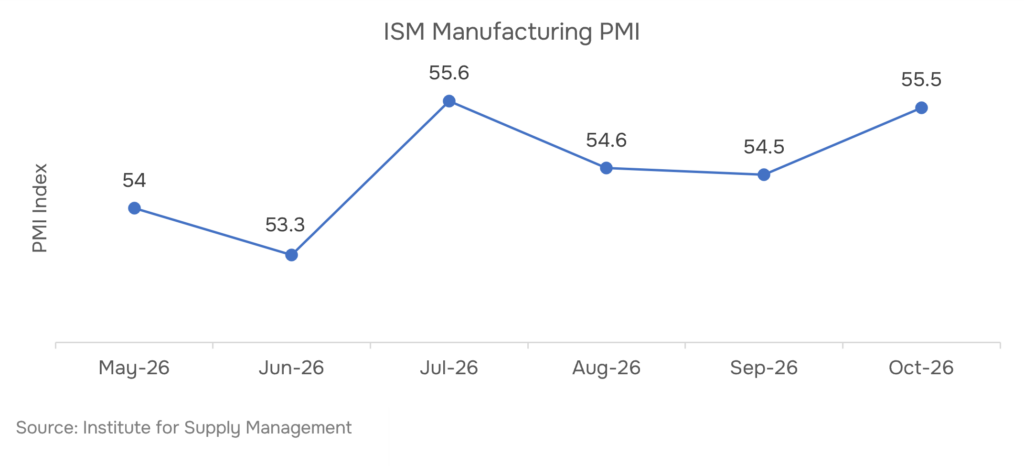
US consumer prices rose 0.4% month over month in October 2026, released November 10, versus a 0.3% forecast. September’s gain was 0.6%. Core CPI, excluding food and energy, rose 0.3% against a 0.2% forecast. Notably, that matched August and September, the third straight month of firm underlying pressure.
The index for shelter rose 0.3% and accounted for over 30% of the monthly increase. Meanwhile, food climbed 0.5%, with beef up 0.9%. Energy rose 0.7% after a 5.2% jump in September, and pump prices stood 37.4% above a year earlier. The Bureau of Labor Statistics did not publish an annual headline rate for October because the federal appropriations lapse prevented collection of October 2025 survey data.
The latest annual reading, September 2026, stands at 3.7%, up from 3.4% in August. Monthly headline changes ran 0.9% in March, 0.6% in April and 0.5% in May. The index then fell 0.4% in June before rising 0.1% in July and 0.4% in August. In addition, Federal Reserve Governor Christopher Waller supports a rate hike. The next CPI release, covering November, is due December 10, 2026. Persistent services-driven core inflation keeps Treasury yields and Federal Reserve policy expectations sensitive heading into the December 8–9 policy meeting.
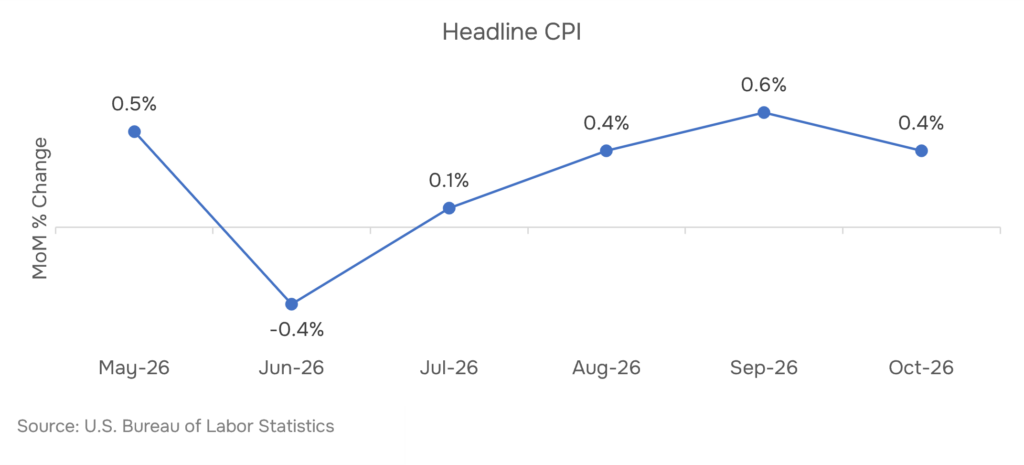
Total nonfarm payroll employment rose by 165,000 in October 2026, released November 6, versus a 65,000 forecast. Private payrolls added 159,000 jobs, while government added 6,000. Notably, revisions lifted September to 60,000 from 29,000, and added 84,000 jobs across August and September.
The unemployment rate dipped to 4.1% from 4.2%, remaining within a 4.1%–4.3% range since March. Average hourly earnings rose $0.14, or 0.4%, to $38.00, a 3.1% annual gain. Transportation and warehousing added 25,000 jobs, including 17,000 among couriers and messengers. Professional and business services and healthcare led gains. In addition, the prime-age employment-population ratio rose 0.02 percentage point to 80.70%.
However, involuntary part-time employment jumped by 339,000, and the broader U-6 rate rose to 7.9% from 7.6%. Meanwhile, the average private workweek held at 34.4 hours, and the manufacturing workweek held at 40.5 hours. Payrolls ran more than three times the 12-month average. Consequently, market-implied odds of a December 8–9 Federal Reserve rate hike climbed close to 80%. Resilient hiring, moderate wage growth and rising underemployment complicate the Fed’s path, and keep US equities, Treasuries and the dollar sensitive to rate-hike expectations. Notably, sponsors planning exits need to reassess financing timelines.
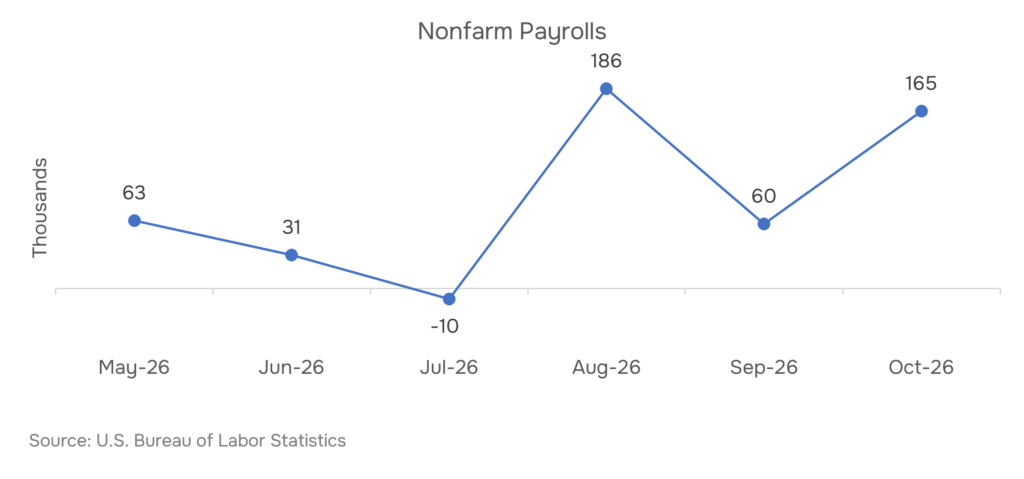
The US international trade deficit narrowed 0.7% to $105.0 billion in September 2026, from $105.7 billion in August. The release arrived November 4. Meanwhile, exports rose 1.9% to $321.5 billion, while imports increased 1.2% to a record $426.6 billion. Goods imports reached an all-time high of $346.9 billion, up 1.3%, while goods exports rose 2.5% to $211.0 billion.
Services trade also set records, with exports at $110.5 billion and imports at $79.7 billion. That implies a services surplus of $30.8 billion. The advance goods deficit of $134.9 billion, published October 28, reflected a 7.5% jump in capital goods imports tied to AI infrastructure buildout demand. Advance estimates, however, remain subject to revision.
The average deficit for the three months ending September exceeded the year-earlier period by $36.5 billion. In addition, average imports rose $12.7 billion to $417.2 billion. The deficit also stayed above $100 billion for a second consecutive month. With the next release covering October due December 8, 2026, trade suggests a drag on third-quarter GDP growth. Moreover, strong domestic demand continues to pull in imports and widen the external imbalance for global supply chains and currency markets. Consequently, capital goods imports linked to AI buildouts deserve close tracking.
US growth remains resilient, with factory activity at 55.5, payrolls up 165,000, and unemployment at 4.1%, but 0.3% core inflation and record $426.6 billion imports keep Federal Reserve rate-hike risk elevated.
The October trade report is due December 8, 2026, and the November CPI follows on December 10, 2026. The November CPI also restores annual comparisons that October lacked. (Source: U.S. Bureau of Economic Analysis) (Source: U.S. Bureau of Labor Statistics)
No. October payrolls rose 165,000 and unemployment fell to 4.1%, but market-implied hike odds near 80% reflect probability, not a decision. Meanwhile, U-6 rose to 7.9% and involuntary part-time work jumped by 339,000. (Source: U.S. Bureau of Labor Statistics)
The federal appropriations lapse prevented collection of October 2025 data, so no annual headline rate exists for October. The latest annual figure remains 3.7% for September, while October’s monthly readings were 0.4% headline and 0.3% core. Analysts should avoid mixing those bases until November data arrive. (Source: U.S. Bureau of Labor Statistics)
September goods imports hit a record $346.9 billion, and total imports reached $426.6 billion. Advance goods data pointed to capital goods linked to AI infrastructure buildouts. Advance figures remain subject to revision. (Source: U.S. Bureau of Economic Analysis) (Source: U.S. Census Bureau)
Share On




 info@rckanalytics.com
 +91 914 533 9262
 +91 (20) 46046669
 M 109 City Avenue, Shankar Kalat Nagar, Wakad, Pimpri-Chinchwad, Pune, Maharashtra, India - 411 057


Services
Sectors
Resources
Company
Copyright © 2026. RCK Analytics - All Rights Reserved.