
Macroeconomy
6 min Read
23 Oct, 2026
Share On



This US macroeconomic report covers four releases published October 14–20, 2026: real earnings, import and export prices, industrial production, and housing starts. Together, they show whether the inflation signals flagged in the prior week’s CPI and PPI edition are moving through trade pipelines and household budgets. For investment bankers, PE/VC sponsors, and credit analysts, the data frames financing costs, margin assumptions, and deal timing. Real hourly pay is falling, imported costs are rising, and housing activity remains soft. As a result, underwriting assumptions deserve a fresh look this week.
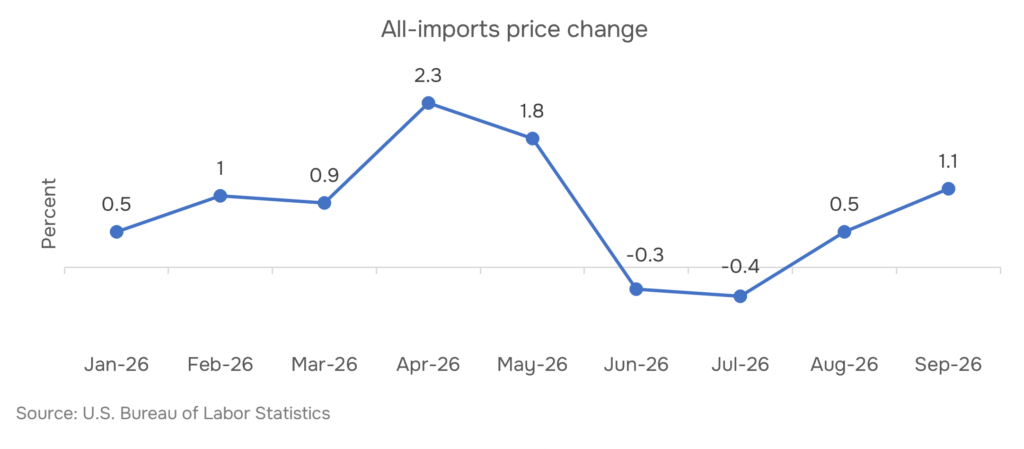
September 2026 data show price pressure re-accelerating faster than income, while real activity splits unevenly. Import prices rose 1.1% MoM and 8.1% year-on-year, the highest since July 2022, and export prices gained 2.2% MoM and 11.6% year-on-year. Fuel drove both, with import fuel prices up 34.5% annually.
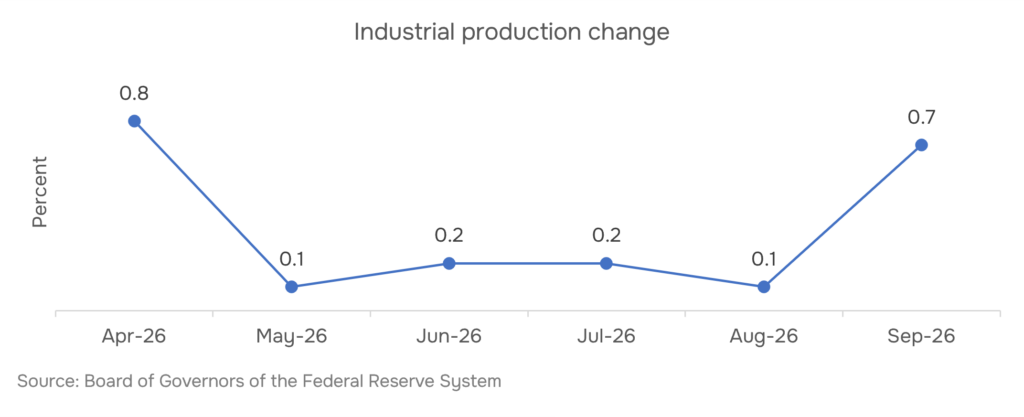
Meanwhile, industrial production increased 0.7% to 104.0, led by utilities +3.5% and semiconductors +19.9% year-on-year. Manufacturing rose only 0.3%, however, and motor vehicle output fell 3.0%. Capacity utilization improved to 76.9%, still 2.5 points below its long-run average. Housing stayed soft: starts fell 5.2% to 1.221 million annualized, 7.4% below a year earlier, and permits slipped to 1.400 million, down 3.0% year-on-year, though sampling error is wide. For households, inflation outran wages.
Consumer prices rose 0.6% against 0.1% hourly pay growth, which cut real hourly earnings 0.5% to $11.24 and left them 0.7% lower annually. As a result, imported cost pressure, thin factory slack and eroding purchasing power complicate the investment outlook ahead of the November 10 and November 17, 2026 releases.
The import and export price index showed U.S. import prices rising 1.1% in September 2026, after a 0.5% August gain. As a result, the 12-month increase reached 8.1%, the largest since the 8.8% advance for the year ended July 2022. Fuel import prices jumped 4.8% in September, following a 0.2% August dip and a 6.8% July drop. They now sit 34.5% above September 2025, with petroleum up 35.4% and natural gas up 96.5%, a shift that matters for commodities exposure.
Nonfuel import prices rose 0.7% and have not fallen monthly since August 2025. They are up 6.0% annually, the fastest pace since April 2022. Export prices, meanwhile, advanced 2.2% after a 1.2% August increase, taking annual growth to 11.6%, the strongest since July 2022. Agricultural exports gained 2.6%, the biggest monthly rise since November 2022, led by soybeans, corn and wheat. Non-agricultural exports rose 2.1% and are up 11.8% year-on-year, while fuel export prices climbed 8.7%.
Trade partners show similar pressure. Terms of trade with the European Union improved 3.6%, the largest monthly gain since January 2018, when monthly figures began, and China’s rose 2.0%. Import prices from China rose 0.7%, the largest monthly increase since December 2021, while Canada rose 1.3%. Notably, import air freight is 25.7% higher year-on-year. Price indexes stay subject to revision for three months. Readers tracking tariff-driven input costs can compare this copper price rally analysis with the figures above, and investment research teams can map them to sector margins.
Industrial production and capacity utilization both improved in September 2026. Output increased 0.7% after a 0.1% August gain, lifting the index to 104.0, a 2.2% above September 2025. Third-quarter output expanded at a 2.8% annual rate. Utilities drove the gain: output jumped 3.5% in September and grew at a 14.8% annualized pace in the third quarter, led by electric utilities, up 3.7% month-on-month. For manufacturing investors, the breadth of that gain matters.
Factories lagged, however. Manufacturing output rose 0.3% but advanced only 0.7% annualized in the quarter, as motor vehicles and parts fell 3.0%. Vehicle assemblies slipped to 10.21 million units annualized from 10.61 million in August. Mining increased 0.2%, growing 5.0% annualized in the quarter. In contrast, semiconductor output rose 28.4% annualized in the third quarter and is 19.9% higher year-on-year, while the broader high-technology group is up 17.5%. This US manufacturing outlook explains why strategic capital is concentrating in such pockets.
Total capacity utilization rose to 76.9% from 76.4%, still 2.5 percentage points below the 1972–2025 average of 79.4%. Manufacturing utilization edged up to 75.9%, 2.3 points below its average. Mining reached 87.5%, and utilities climbed 2.3 points to 73.8%. Primary and semifinished processing utilization rose to 77.2% from 76.3%. Industrial capacity expanded 1.1% annualized in the third quarter. An annual benchmark revision rebasing the indexes to 2022 is scheduled for November 24, 2026, and September’s reading is preliminary and subject to revision. Financial modeling teams can embed the utilization gap in capacity assumptions.
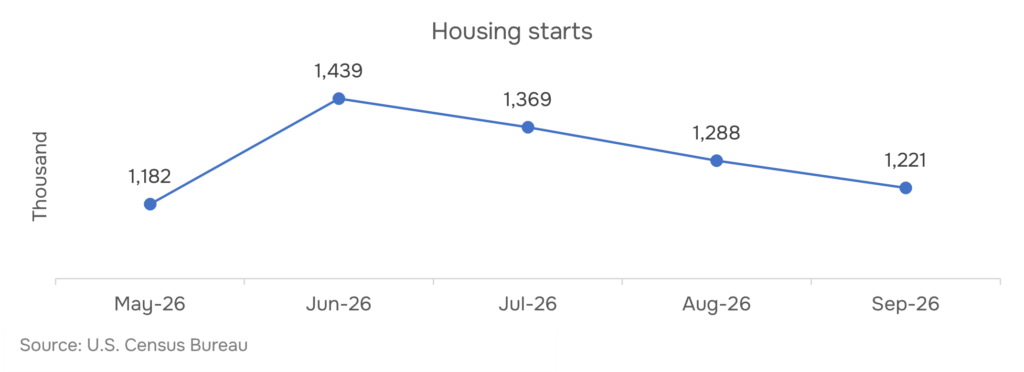
US housing starts fell 5.2% in September 2026 to a seasonally adjusted annual rate of 1.221 million units, from a revised 1.288 million in August. Starts are 7.4% below the 1.319 million of September 2025. However, margins of error of ±11.8% and ±11.5% mean neither change is statistically distinguishable from zero. Single-family starts declined 4.6% to 859,000 from 900,000, while buildings with five or more units started at 349,000. Rate-sensitive lending matters here, as the September rate decision shows for BFSI readers.
Building permits slipped 0.2% to 1.400 million from a revised 1.403 million, and sit 3.0% below the 1.444 million of September 2025. Single-family authorizations dropped 4.0% to 845,000 from 880,000, with five-plus-unit permits at 503,000. Completions, meanwhile, rose 2.2% to 1.192 million from 1.166 million but remain 14.0% below the 1.386 million of September 2025. Single-family completions eased 2.4% to 840,000, and multifamily completions reached 339,000. Sponsors facing slower exits can read about the private equity exit bottleneck.
Starts exceed completions by only 29,000 units annualized, and permits run 179,000 above starts. Based on these gaps, authorizations may not yet have converted into construction. The 3.0% annual permit decline points to builder caution on near-term supply, and all figures are subject to revision. PE/VC support teams can adjust hold-period assumptions accordingly.
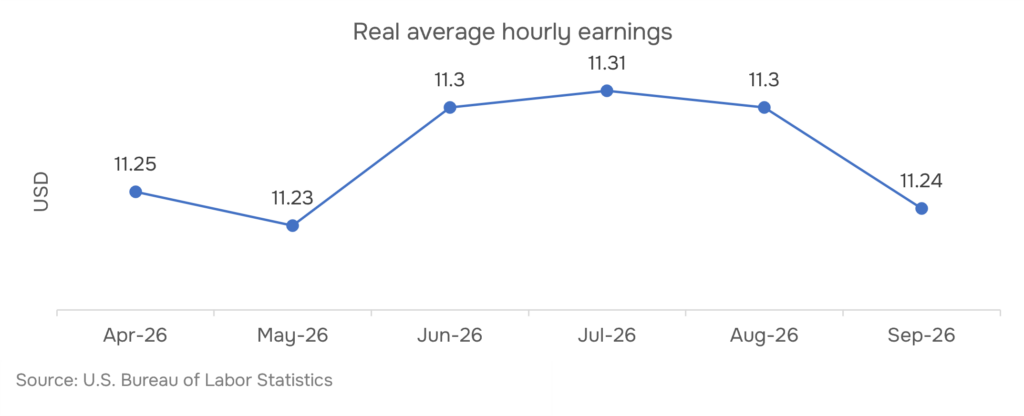
Real average hourly earnings for all employees fell 0.5% in September 2026 to $11.24 from $11.30 in August. Average hourly earnings rose just 0.1% to $37.81, while the consumer price index climbed 0.6%, as the CPI and PPI edition detailed. Consequently, real average weekly earnings dropped 0.5% to $386.76 from $388.75, with the average workweek unchanged at 34.4 hours.
Over the year, real hourly earnings are down 0.7% from $11.32 in September 2025. Real weekly earnings are 0.1% lower from $387.10, cushioned by a 0.6% longer workweek. Nominal hourly wage growth has slowed from 3.8% in September 2025 to 3.0%, whereas consumer price inflation accelerated from 3.0% to 3.7%. The real wage differential therefore flipped from +0.8% to −0.7%.
Production and nonsupervisory workers fared worse. Their real hourly earnings fell 0.6% to $9.88 from $9.94, as wages rose 0.2% to $32.60 against a 0.7% rise in their price index. That index is now up 3.9% year-on-year versus 3.3% wage growth. Their real weekly earnings declined 0.5% to $334.07, down 0.3% annually. Meanwhile, average weekly earnings for all employees reached $1,300.66, up 3.6% year-on-year. August and September figures are preliminary. Weaker purchasing power matters for FMCG demand, and market intelligence work can track consumer-spend sensitivity.
Rising trade costs and selective industrial strength contrast with weaker housing activity and falling real earnings, leaving margins, credit quality and consumption exposed as investors reassess sector resilience and financing risks.
The October release is scheduled for Tuesday, November 17, 2026, at 8:30 a.m. ET. September’s 8.1% annual rise in import prices was the largest since July 2022. (Source: U.S. Bureau of Labor Statistics)
No. September hourly earnings rose 0.1% to $37.81, but consumer prices rose 0.6%, so real hourly earnings fell 0.5% to $11.24. The October real earnings release is due November 10, 2026. (Source: U.S. Bureau of Labor Statistics)
The 5.2% decline carries a ±11.8% margin of error, so it is not statistically distinguishable from zero. Permits, down 3.0% year-on-year to 1.400 million, offer a useful cross-check. (Source: U.S. Census Bureau)
Utilities led, with output up 3.5%, while semiconductors rose 19.9% year-on-year. Manufacturing gained only 0.3%, and the September estimate is preliminary and subject to revision. (Source: Federal Reserve Board)
Share On




 info@rckanalytics.com
 +91 914 533 9262
 +91 (20) 46046669
 M 109 City Avenue, Shankar Kalat Nagar, Wakad, Pimpri-Chinchwad, Pune, Maharashtra, India - 411 057


Services
Sectors
Resources
Company
Copyright © 2026. RCK Analytics - All Rights Reserved.