
Macroeconomy
6 min Read
30 Oct, 2026
Share On



This US macroeconomic report covers the Federal Reserve’s October 28 rate decision, September PCE inflation, the Q3 GDP advance estimate, and October consumer confidence. Together, the releases show whether stronger output is easing or complicating financing conditions. For investment bankers, PE/VC sponsors, and credit analysts, the data frames refinancing costs, deal timing, and demand assumptions. The previous edition on inflation, pay, output and housing flagged the household squeeze. This week’s data tests how far it extends.
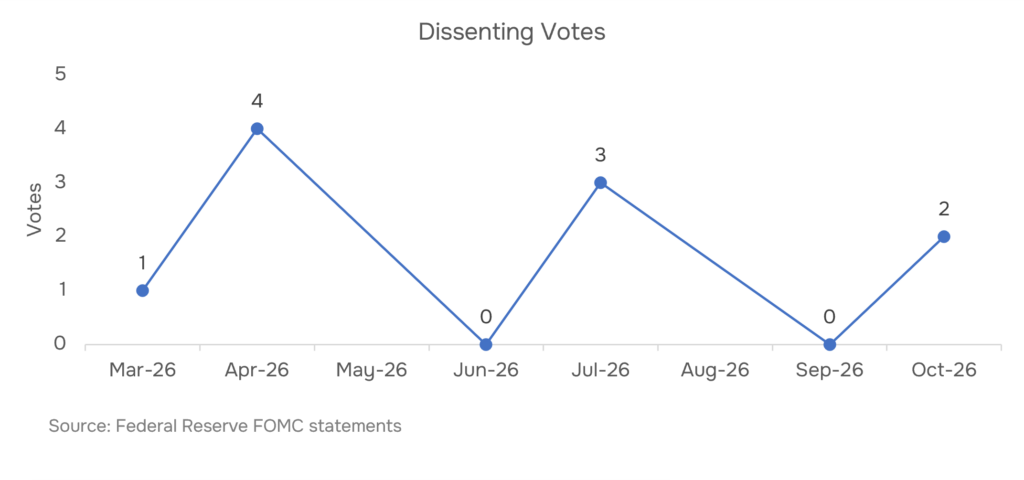
The latest US economic releases point to resilient output alongside persistent inflation and uneven household confidence. On October 28, the Federal Reserve held its policy rate at 3.75%–4.00%, with a 10–2 vote revealing disagreement over the response to elevated inflation. September core PCE inflation reached 3.1% year over year, while headline PCE rose to 3.6%, keeping both measures above the Fed’s 2% objective.
Meanwhile, the BEA’s October 29 advance estimate showed Q3 real GDP expanding at a 3.4% annualized rate, up from 2.2% in Q2. Real final sales to private domestic purchasers increased 4.9%, indicating firm underlying domestic demand. However, weaker exports and higher imports weighed on the external contribution. GDP price measures moderated from Q2, which offers a counterpoint to the latest monthly inflation data.
Consumer confidence rose 7.5 points to 91.7 in October, but the Expectations Index remained at 72.6, and households continued to flag living-cost pressures. As a result, stronger activity does not remove inflation, financing, or consumption risks. Q4 assessments should track price momentum, real spending, employment, and policy signals together. The GDP figure is an advance estimate and subject to revision.
The Federal Reserve held the federal funds target range at 3.75%–4.00% on October 28, 2026. The 10–2 vote shows disagreement over whether current settings are restrictive enough. Meanwhile, activity remains firm, domestic demand is resilient, and business investment continues. Inflation, however, still sits above the 2% objective. After the September rate hike, the pause preserves flexibility as policymakers weigh incoming price, employment, and spending data.
September core PCE inflation reached 3.1% year over year, up from 3.0% in August, while headline PCE stood at 3.6%. The advance estimate showed Q3 real GDP expanding at a 3.4% annualized rate, compared with 2.2% in Q2. As a result, above-target inflation alongside stronger output weakens the case for near-term cuts. Rising yields are reshaping BFSI outcomes in the same environment.
For borrowers, sponsors, and banks, the 3.75%–4.00% range keeps refinancing assumptions central. Higher-for-longer rates affect debt-service coverage, transaction affordability, discount rates, and valuation multiples. The pause signals neither a clear easing cycle nor another increase. Instead, future decisions depend on whether inflation moderates without material damage to employment or activity. PE/VC support teams can stress-test financing structures against that range, while markets watch yields, spreads, and borrowing demand.
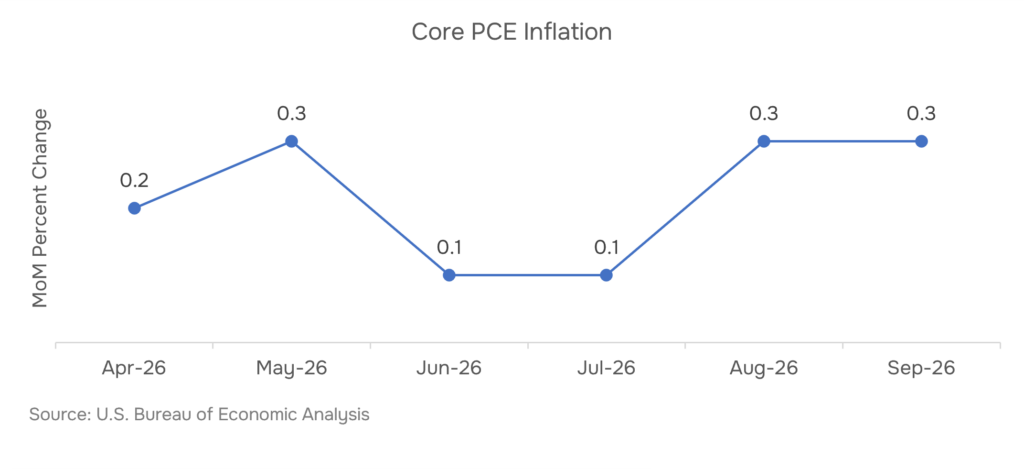
The September 2026 PCE price report, released October 29, showed core PCE inflation at 3.1% year over year, compared with 3.0% in August. Core prices rose 0.3% month over month, matching August’s pace. Headline PCE inflation reached 3.6%, up from 3.4% in August, and rose 0.5% in September versus 0.3% a month earlier. This extends the pressure tracked in the CPI and PPI edition.
The gap between headline and core reflects food and energy prices. However, steady monthly core gains show pressure beyond volatile categories, and both measures remain above the 2% objective. The same release showed real disposable personal income declining 0.3% month over month, while real personal consumption expenditure was virtually unchanged. Consequently, households faced higher prices without matching gains in income or consumption. Long-end borrowing costs add to the strain, as bond yields near 2007 levels illustrate.
Persistent core inflation matters through borrowing costs, wage negotiations, operating expenses, and discount rates. If monthly core inflation stays near 0.3%, progress toward the target may remain slow. As a result, policy could stay restrictive, adding uncertainty to financing conditions, earnings forecasts, and valuations. Credit research teams can map that path to covenant and spread risk.
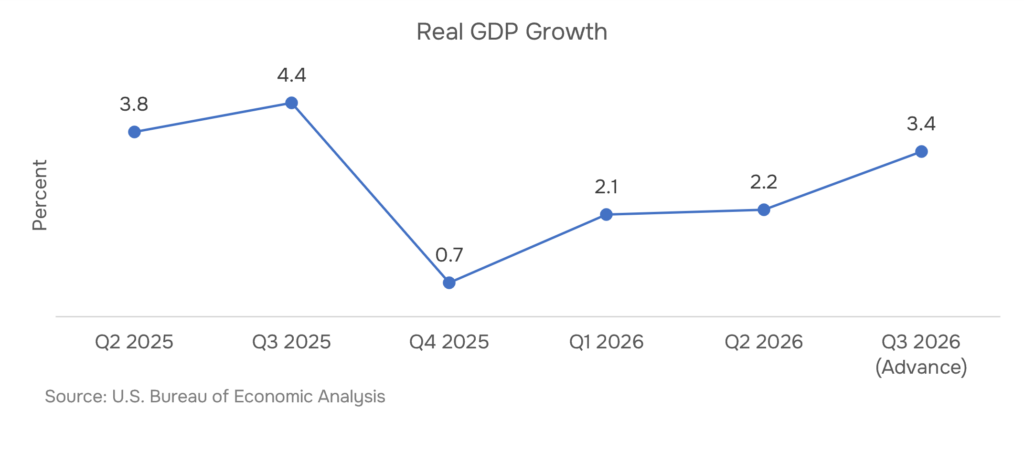
The Bureau of Economic Analysis reported in its October 29 advance estimate that real GDP rose at a 3.4% annualized rate in Q3 2026. That followed 2.2% in Q2, an acceleration of 1.2 percentage points. Consumer spending, investment, and government expenditure supported expansion. However, weaker exports partly offset domestic activity. Readers can compare this with the Q2 2026 earnings and sector analysis.
Real final sales to private domestic purchasers, which exclude inventories and government spending, rose at a 4.9% annualized rate, versus 4.6% in Q2. Business investment also contributed. Meanwhile, exports declined and imports increased, creating a net-trade drag. External demand therefore did not share domestic strength, a gap relevant to manufacturing exporters.
Price measures moderated. The gross domestic purchases price index rose 3.0%, down from 5.6% in Q2, while the PCE price index excluding food and energy rose 2.5%, versus 3.3%. Real activity alongside slower price growth is constructive, though the advance estimate remains subject to revision. For lenders and planners, the data support demand assumptions but keep trade exposure, input costs, and rate sensitivity central. Financial modeling should reflect those Q4 sensitivities.
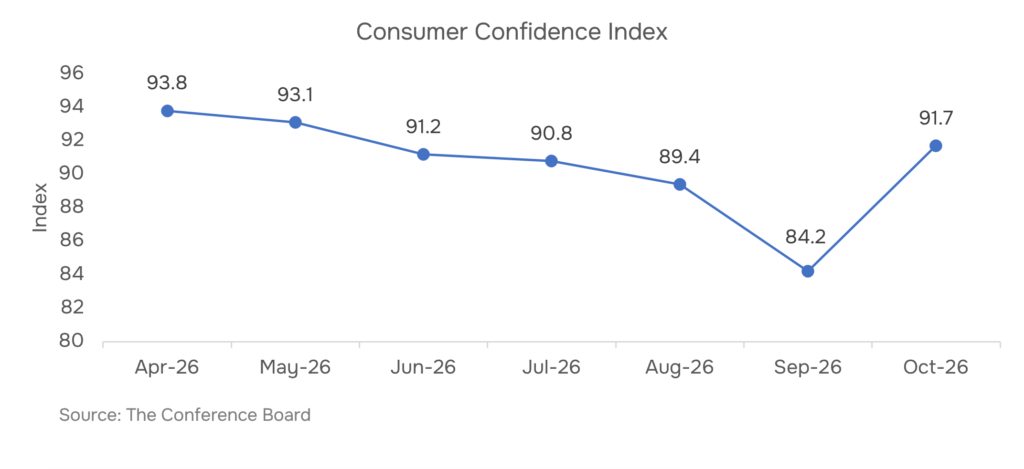
The Conference Board’s Consumer Confidence Index rose 7.5 points to 91.7 in October 2026, from 84.2 in September. The Present Situation Index gained 8.6 points to 120.4, while the Expectations Index advanced 6.9 points to 72.6. The rebound partially reversed three consecutive monthly declines in expectations. Even so, the forward-looking measure remained weak, a gap that FMCG businesses should read carefully.
Consumers rated current conditions better: the share calling business conditions good rose to 21.4% from 18.8%, and easing gasoline prices supported sentiment. However, the rebound does not yet confirm stronger spending. Mentions of prices, food, groceries, oil, and diesel costs increased in survey responses. These concerns matter because essential expenses can absorb income that would otherwise fund discretionary purchases. Employment prospects remain a key variable, as the payrolls edition documented.
Household consumption is a major component of GDP. Stronger confidence can lift discretionary demand, but food, energy, and housing costs may limit purchasing power. Consequently, October improves the sentiment signal without resolving uncertainty around real consumption, employment, or household balance sheets. Notably, markets reprice confidence before credit risk, so sentiment shifts warrant monitoring.
The U.S. economy is expanding, but persistent inflation, restrictive rates and cautious household expectations complicate capital allocation, financing costs and Q4 investment decisions across private markets and corporate balance sheets.
The Fed held the federal funds target range at 3.75%–4.00% on a 10–2 vote. The split reflects disagreement over whether current policy is restrictive enough against inflation above the 2% objective. (Source: Federal Reserve Board)
The BEA published the advance estimate on October 29, 2026, showing a 3.4% annualized rate. Because it is an advance estimate, later releases may revise it. (Source: U.S. Bureau of Economic Analysis)
The index rose 7.5 points to 91.7, but the Expectations Index stayed at 72.6, and survey mentions of living costs increased. Higher confidence has not consistently translated into discretionary purchases when essentials absorb more income. (Source: The Conference Board)
Core PCE inflation stands above the Fed’s 2% objective, and core prices rose 0.3% month over month in both August and September. That steady pace, alongside a 0.3% monthly decline in real disposable personal income, complicates the case for near-term easing. (Source: U.S. Bureau of Economic Analysis)
Share On




 info@rckanalytics.com
 +91 914 533 9262
 +91 (20) 46046669
 M 109 City Avenue, Shankar Kalat Nagar, Wakad, Pimpri-Chinchwad, Pune, Maharashtra, India - 411 057


Services
Sectors
Resources
Company
Copyright © 2026. RCK Analytics - All Rights Reserved.