
Macroeconomy
5 min Read
25 Sep, 2026
Share On



This week’s US macroeconomic report covers four releases between September 22 and September 24, 2026, showing private-sector momentum accelerating even as external imbalances widen. S&P Global’s flash Composite PMI hit a 54-month high, the current-account deficit widened 15.7% in the second quarter, a regional services survey showed activity contracting as hiring surged, and jobless claims stayed near historic lows. This builds on the resilience theme confirmed in last week’s Fed rate hike report, now showing up across multiple indicators simultaneously.
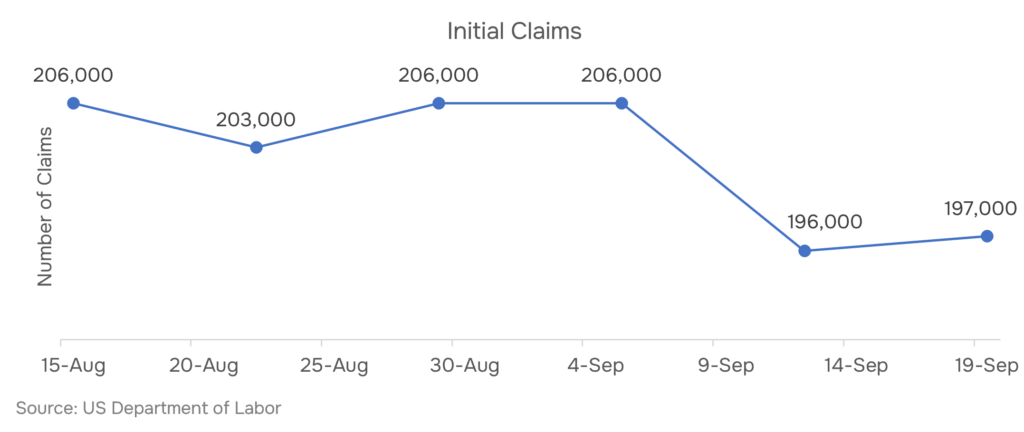
Four releases between September 22 and September 24, 2026 painted a genuinely complex picture of an accelerating economy alongside widening external imbalances. S&P Global’s flash Composite PMI jumped to 58.4 in September, a 54-month high, with manufacturing and services both posting some of their strongest readings in years. The U.S. current-account deficit widened 15.7% to $246.0 billion in the second quarter, reaching 3.0% of GDP, as imports and foreign income payments grew considerably faster than exports and income receipts.
The Philadelphia Fed’s Nonmanufacturing Business Outlook Survey showed regional activity falling to a three-month low of -22.0, while its full-time employment index simultaneously jumped to 19.0, its best reading since June 2022, a genuine internal divergence within the same release. Initial jobless claims fell to 196,000 for the week ended September 20, the second-lowest reading since July’s 60-year low, reinforcing broader signals of labor market resilience.
Together, the data suggests private-sector momentum and labor market strength are building even as the current-account deficit and the US net international investment position, now negative $22.42 trillion, continue widening heading into the fourth quarter.
S&P Global reported on September 23, 2026 that its flash US Composite PMI rose to 58.4 in September from 56.0 in August, marking the fastest pace of private-sector expansion since July 2021. The reading extended a fourth consecutive month of accelerating growth.
The Manufacturing PMI jumped to 57.0 from 53.9, well above consensus and the strongest improvement in manufacturing business conditions since May 2022. Meanwhile, the Services Business Activity Index rose to 58.7 from 54.6, its fastest pace in years. However, supplier delivery times lengthened to the greatest extent since July 2022, signaling capacity constraints alongside the acceleration, a dynamic RCK Analytics’ Manufacturing sector coverage is tracking closely.
Consequently, this acceleration raises real questions about whether current capital investment is keeping pace with demand, a theme explored further in RCK Analytics’ AI Architecture Gap whitepaper.
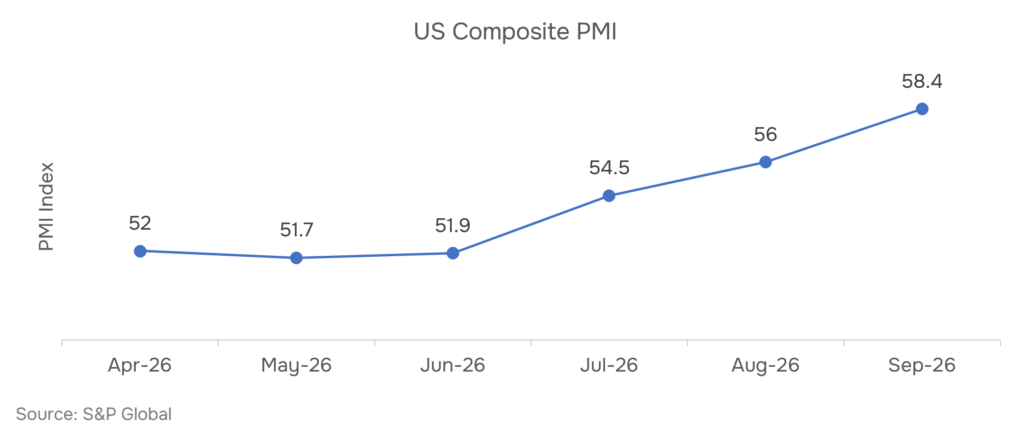
The U.S. Bureau of Economic Analysis reported on September 24, 2026 that the current-account deficit widened by $33.4 billion, or 15.7%, to $246.0 billion in the second quarter of 2026, up from a revised $212.6 billion in the first quarter. The deficit rose to 3.0% of current-dollar GDP, up from 2.7% in the prior quarter.
Exports of goods and services, along with income received from foreign residents, rose $58.8 billion to $1.44 trillion, while imports and income paid to foreign residents rose $92.2 billion to $1.69 trillion. As a result, imports grew considerably faster than exports during the quarter. Net financial-account transactions totaled negative $369.7 billion, reflecting net US borrowing from foreign residents.
The broader net international investment position stood at negative $22.42 trillion at quarter’s end, widening from negative $21.27 trillion in the first quarter.
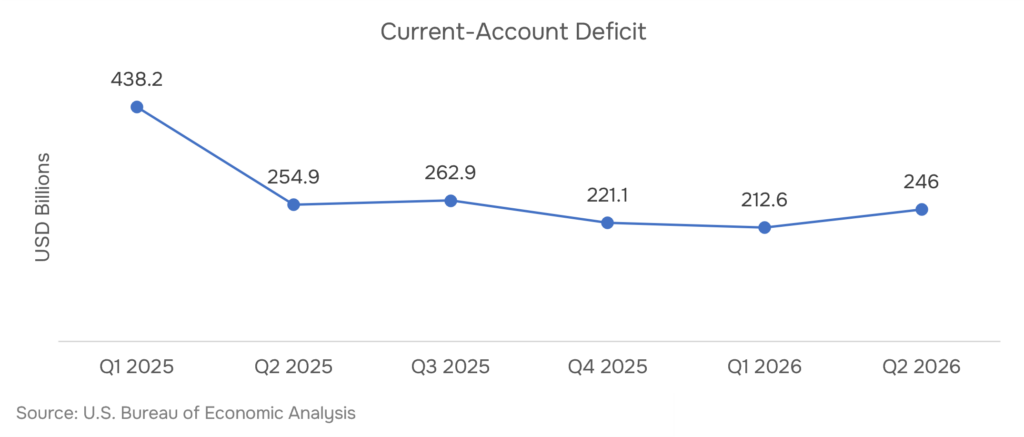
The Federal Reserve Bank of Philadelphia reported on September 22, 2026 that its Nonmanufacturing Business Outlook Survey’s regional activity index fell to -22.0 in September from -10.6 in August, its lowest reading since June. New orders improved modestly to -2.2 from -10.1.
The survey’s employment components told a markedly different story: the full-time employment index jumped to 19.0 from 2.1, its highest level since June 2022, with 27% of firms reporting they added staff in September. Meanwhile, both price indexes increased, with prices paid climbing to 37.8 from 29.2.
This divergence between contracting current-period sentiment and accelerating hiring intentions represents a genuine departure from the low-hire, low-fire labor pattern discussed in RCK Analytics’ Fed rate hike report, relevant to RCK Analytics’ Hospitality sector coverage given the survey’s services-sector focus.
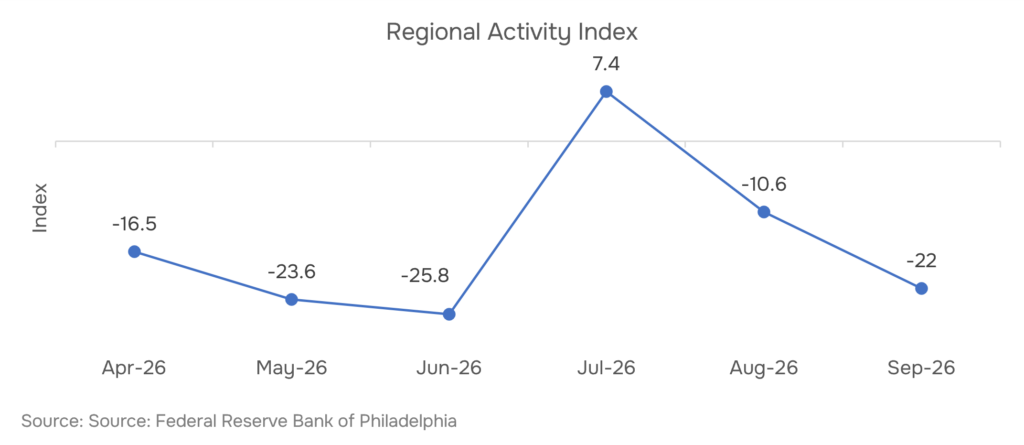
The U.S. Department of Labor reported on September 24, 2026 that initial jobless claims fell by 10,000 to 196,000 for the week ended September 20, well below consensus and the second-lowest weekly reading since claims touched a 60-year low of 189,000 in mid-July. Continuing claims fell by 39,000 to 1,730,000, the lowest level since January 2024.
Initial claims filed by federal employees rose by just 10 to 398, remaining well below historical levels associated with broader public-sector layoffs. As a result, the data extends a period of labor market resilience multiple Federal Reserve officials have cited as consistent with full employment, a dynamic RCK Analytics’ Credit Research team is weighing alongside the yield dynamics discussed in Why Long Bond Yields Are Near 2007 Levels.
Flash PMI hit a 54-month high, the current-account deficit widened 15.7% to $246.0 billion, a regional survey showed activity falling as hiring surged, and jobless claims stayed near a 60-year low.
Yes, September 2026’s Nonmanufacturing Business Outlook Survey demonstrated this directly: the regional activity index fell to -22.0, its lowest since June, while the full-time employment index simultaneously rose to 19.0, its best reading since June 2022, reflecting firms’ hiring intentions diverging from near-term activity sentiment. (Source: Federal Reserve Bank of Philadelphia, Nonmanufacturing Business Outlook Survey)
A widening deficit is more likely structural when it’s driven by imports outpacing exports over multiple quarters rather than a single volatile category; Q2 2026’s 15.7% widening reflected imports and foreign income payments rising $92.2 billion against a $58.8 billion rise in exports and income receipts, a pattern worth monitoring across subsequent quarters. (Source: U.S. Bureau of Economic Analysis, U.S. International Transactions, Q2 2026)
Manufacturers and services firms with pricing power benefit most, since September 2026’s PMI data showed both new orders and business activity accelerating alongside rising input costs, meaning firms able to pass costs through are positioned better than those facing margin compression from lengthening supplier delivery times. (Source: S&P Global, Flash US PMI, September 2026)
Not necessarily on its own. September 2026’s 196,000 reading reflects low separations rather than confirmed hiring strength, and should be read alongside broader payroll and revision data, such as that covered in RCK Analytics’ prior payrolls report, rather than as a standalone confirmation of hiring momentum. (Source: U.S. Department of Labor, Unemployment Insurance Weekly Claims Report)
Share On



 info@rckanalytics.com
 +91 914 533 9262
 +91 (20) 46046669
 M 109 City Avenue, Shankar Kalat Nagar, Wakad, Pimpri-Chinchwad, Pune, Maharashtra, India - 411 057


Services
Sectors
Resources
Company
Copyright © 2026. RCK Analytics - All Rights Reserved.