


Macroeconomy
5 min Read
16 Oct, 2026
Share On



This US macroeconomic report covers October 8–15, 2026, when September CPI, PPI and retail sales landed alongside the Philadelphia Fed survey. These US economic data matter to investment banking, investment research, PE/VC and credit research teams. An energy-led price shock now collides with softer demand, which affects margins, financing costs and exit timing. The previous edition examined stalling payrolls and the Fed’s hawkish signal. This week’s prints test how far inflation complicates that path.
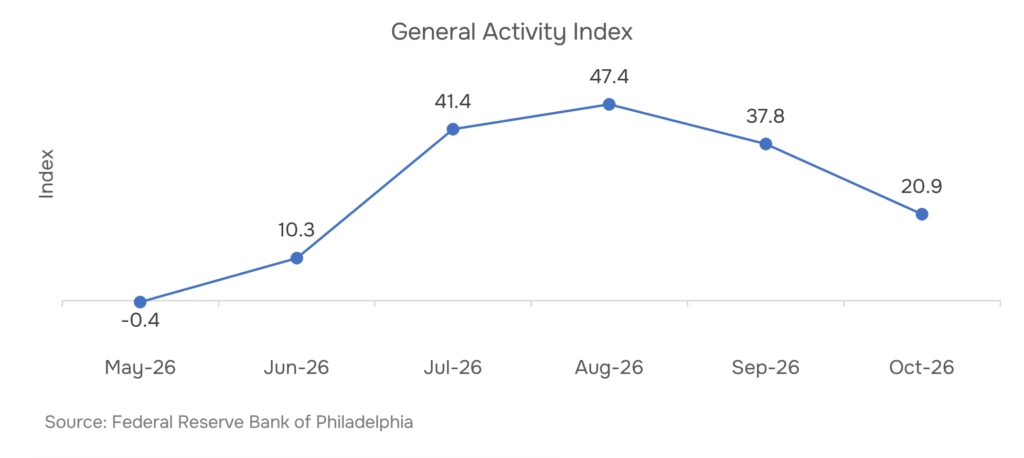
The U.S. economy faces moderating manufacturing momentum, accelerating inflation and increasingly distorted consumer spending. The Philadelphia Fed general activity index fell to 20.9 in October from 37.8 in September, a 16.9-point decline. New orders dropped to 4.3 from 29.2, while prices received climbed to 40.1. Meanwhile, the national services PMI eased to 54.9 from 55.4, indicating expansion at a slower pace.
Consumer inflation accelerated to 3.7% annually from 3.4%, as September CPI increased 0.6% monthly and gasoline prices jumped 9.1%. Producer inflation intensified further, with PPI advancing 1.3% monthly and 6.3% annually. Final-demand goods prices rose 2.6%, driven partly by a 10.8% increase in final-demand energy prices.
Retail sales increased 0.8% in September after a revised 1.3% August gain. However, gasoline-station receipts rose 6.4%, while sales excluding gasoline stations increased only 0.2%. Together, these indicators suggest energy-driven inflation is squeezing household budgets and raising business costs while demand moderates. Consequently, margin resilience, pricing power, cash-flow quality and valuation discipline matter more as inflation complicates the Federal Reserve’s policy outlook.
Regional manufacturing kept expanding in October 2026, but momentum faded quickly. The Philadelphia Fed Manufacturing Business Outlook Survey, released October 15, put the general activity index at 20.9. That is 16.9 points below September’s 37.8, and the second straight monthly decline. Roughly 41% of firms reported higher activity, while 20% reported declines. The index stayed positive, so more firms still reported improving conditions than deteriorating ones.
However, demand indicators weakened sharply. New orders fell 25 points to 4.3, while shipments declined 12 points to 15.3. The employment index eased three points to 9.1. Meanwhile, prices paid moderated five points to 43.2, yet prices received rose nine points to 40.1, its highest reading since May 2025. As a result, softer demand now coexists with firmer selling prices.
Firms still expect growth. The future activity index fell 20 points to 33.0, its lowest since January, yet more than 52% of firms plan higher capital spending next year. Consequently, investors should test revenue visibility and margins. Private equity and credit investors should assess whether portfolio companies in the manufacturing sector can sustain cash generation if demand weakens while costs stay elevated.
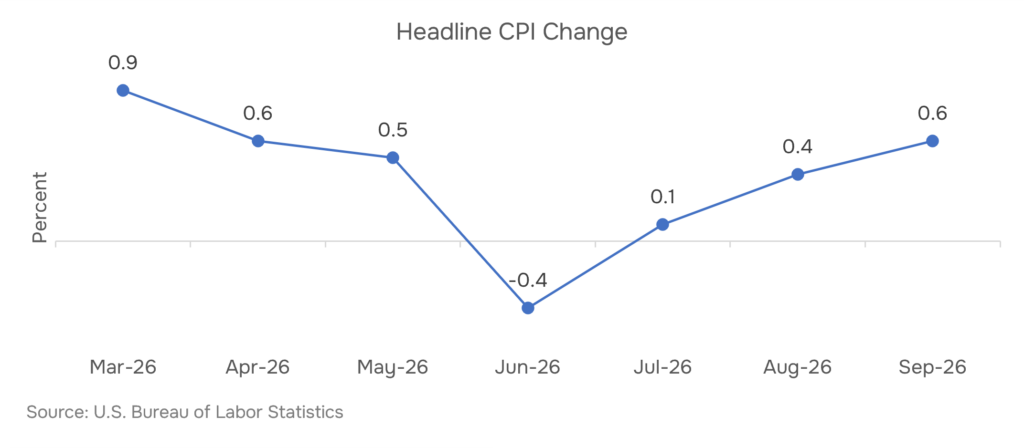
U.S. consumer inflation accelerated in September 2026, reinforcing concerns that energy costs could delay a return to the Federal Reserve’s 2% objective. The Bureau of Labor Statistics reported on October 14 that the Consumer Price Index rose 0.6% month over month, up from 0.4% in August. Annual headline inflation climbed to 3.7% from 3.4%.
Energy was the main driver. Gasoline prices rose 9.1%, accounting for more than half of the monthly headline increase. The energy index advanced 5.2%, compared with 2.1% in August. However, inflation was not only an energy story. Core CPI, which excludes food and energy, rose 0.3% monthly and 2.6% annually, versus 2.4% in August. In addition, shelter costs increased 0.4%.
For investors, separating temporary energy shocks from persistent inflation remains critical. Higher fuel bills can also constrain discretionary spending. The Fed raised rates in September, and market-implied odds of an October hike rose to roughly 50% after the release, according to CME FedWatch. Further tightening would lift borrowing costs and discount rates, as explained in why long-bond yields sit near 2007 levels. Similarly, the Fed’s September hike is already reshaping valuations across BFSI.
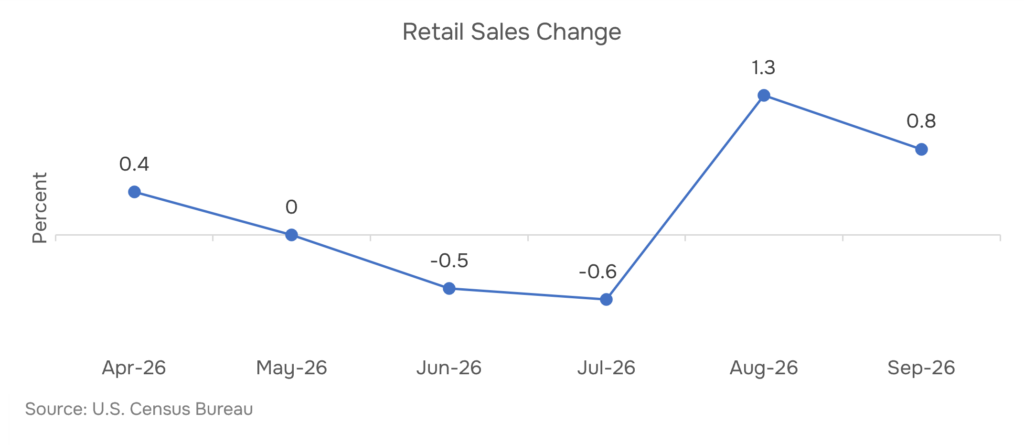
U.S. retail sales rose 0.8% month over month in September 2026, following a revised 1.3% gain in August, according to the Census Bureau’s October 15 release. Headline spending kept rising. However, the slower pace and the mix of spending signal caution. Notably, these advance estimates are nominal, not inflation-adjusted, and remain subject to revision.
Gasoline-station sales jumped 6.4%, accounting for roughly 71% of the monthly increase. Excluding gasoline stations, sales rose only 0.2%, and sales excluding autos and gasoline also rose 0.2%. Over twelve months, total sales rose 6.3%, while gasoline stations surged 28.1%. As a result, headline growth may overstate discretionary demand, since households facing bigger fuel bills have less room for nonessential purchases.
For investment research and private equity, the quality of consumer growth matters as much as its pace. Retailers with strong loyalty, efficient distribution and differentiated products, including those in FMCG, may defend margins more effectively. Meanwhile, credit investors should monitor whether higher household costs lead to weaker volumes, heavier promotions or strained borrower cash flows.
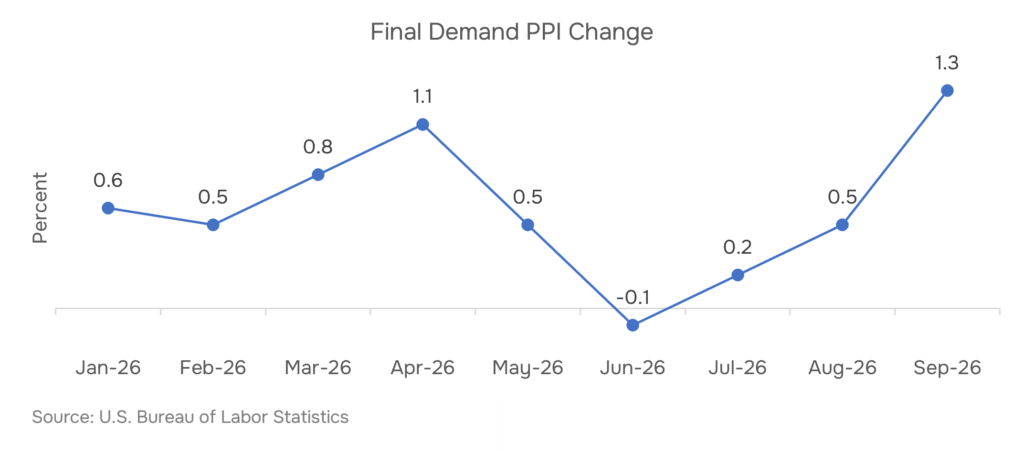
U.S. producer inflation accelerated sharply in September 2026, signalling renewed pressure on business costs. The Bureau of Labor Statistics reported on October 15 that final-demand PPI rose 1.3% month over month, following a revised 0.5% rise in August. Annual producer price inflation reached 6.3%, its largest 12-month increase since December 2022. These figures are preliminary and subject to revision.
Goods prices drove the move. Final-demand goods rose 2.6%, the largest monthly increase since the series began in December 2009. Energy accounted for more than 80% of that gain, as final-demand energy jumped 10.8% and gasoline rose 20.3%. In addition, final-demand services advanced 0.8%. Core PPI, excluding foods, energy and trade services, increased 0.5% monthly and 5.0% annually.
Earnings impact depends on pricing power. Manufacturers, logistics operators and energy and utilities businesses face higher procurement, freight and production costs. Consequently, credit research should stress-test EBITDA margins, working capital, debt-service capacity and refinancing assumptions. If input costs persist while demand moderates, valuation multiples may face pressure from lower earnings and higher financing costs.
U.S. manufacturing momentum is weakening as new orders soften, while consumer and producer inflation accelerate. Investors must prioritize pricing power, margin resilience, cash-flow durability and valuation discipline.
No. Gasoline rose 9.1% and the energy index 5.2%, but core CPI also rose 0.3% monthly and 2.6% annually, up from 2.4% in August. Shelter added 0.4%. (Source: U.S. Bureau of Labor Statistics)
September’s 6.3% annual PPI increase is the largest 12-month rise since December 2022. Monthly, final-demand PPI rose 1.3%. (Source: U.S. Bureau of Labor Statistics)
Yes. September’s 0.8% gain was largely gasoline-driven, with gasoline stations up 6.4% and sales excluding them up only 0.2%. The figures are also nominal, not adjusted for inflation. (Source: U.S. Census Bureau)
It is a regional survey, so it may not mirror national manufacturing. [Likely] The October reading of 20.9, down from 37.8, with new orders at 4.3, flags softening demand. (Source: Federal Reserve Bank of Philadelphia)
Share On




 info@rckanalytics.com
 +91 914 533 9262
 +91 (20) 46046669
 M 109 City Avenue, Shankar Kalat Nagar, Wakad, Pimpri-Chinchwad, Pune, Maharashtra, India - 411 057


Services
Sectors
Resources
Company
Copyright © 2026. RCK Analytics - All Rights Reserved.