


Whitepaper
5 min Read
10 Aug, 2026
Share On


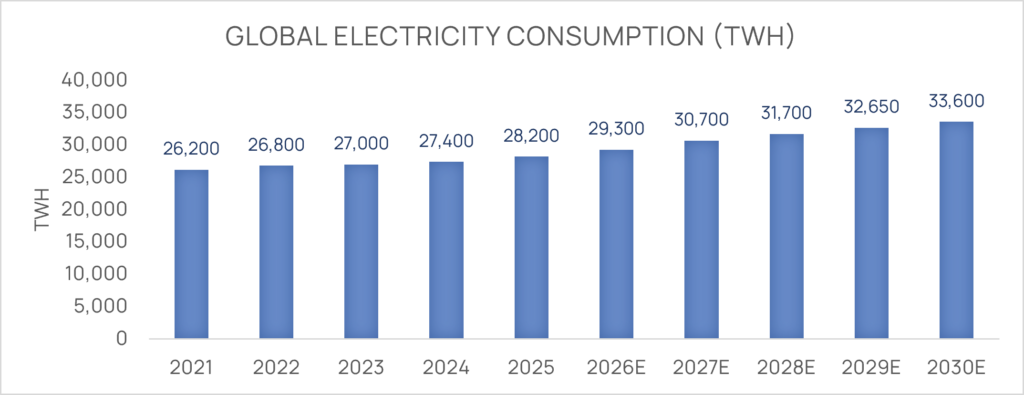
This Whitepaper covers the copper price rally that pushed the metal to a fresh all-time high last week and separates two forces most coverage is treating as one story. Copper hit $6.82 per pound on COMEX, up 47.22% year-over-year, as electrification demand from AI data centers and grid modernization collides with a decade of mine underinvestment. However, a significant share of the current move reflects a US tariff-driven inventory migration, not pure physical scarcity a distinction that changes how long this rally should be expected to last.
Copper hit a fresh all-time high last week, trading between $6.70 and $6.82 per pound, and is up 47.22% year-over-year as of August 7. The structural case is real: global electricity demand, currently around 28,600 terawatt-hours annually, is rising roughly 3% a year toward 30,700 terawatt-hours by 2027, driven by AI data centers, EV charging, and grid modernization, while mine supply is constrained by declining ore grades and 15-to-17-year permitting timelines.
However, a meaningful share of the current price move is policy-driven: US COMEX inventories have surged over 550% since Section 232 tariff proceedings began, while London Metal Exchange stocks have fallen 60%, pushing the COMEX-LME arbitrage to a record spread above $2,600 per tonne.
Copper prices climbed to an all-time high last week. The metal traded between $6.70 and $6.82 per pound on COMEX as of August 5-6, 2026. It’s now up 47.22% year-over-year as of August 7, one of the strongest annual gains of any major commodity in US markets today. Notably, copper’s year-to-date return of roughly 16% has outpaced the S&P 500’s approximate 13% gain over the same period. That’s a rare instance of an industrial metal beating the broader equity market.
However, this isn’t simply a story of stronger global growth. Instead, constrained supply, heavy grid investment, and tariff uncertainty are doing most of the work behind the price move. As a result, copper’s traditional role as a growth indicator has become harder to read this cycle. Trading volume in copper futures has climbed alongside price, reflecting both industrial hedging and speculative positioning.
For firms tracking commodity-linked exposure across portfolios, RCK Analytics’ Commodities coverage follows these price dynamics in more depth. The full report shows which parts of this move will last, and which will likely fade once policy uncertainty resolves.
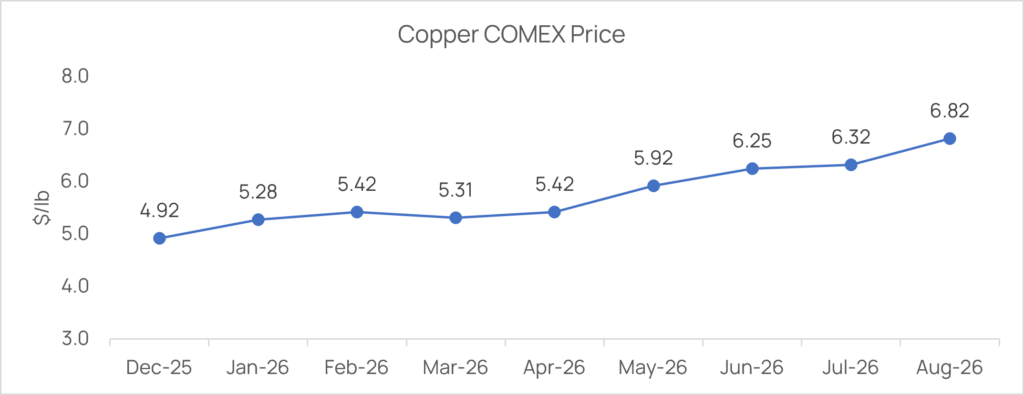
Beneath the price action sits a genuine structural shift in electricity consumption. Copper is the physical metal that delivers it. Global electricity demand currently stands at approximately 28,200 terawatt-hours annually. Analysts project it will rise to roughly 30,700 terawatt-hours by 2027. Meanwhile, the United States alone consumed roughly 4,200 terawatt-hours over the past year, growing at approximately 3% annually.
Copper powers transmission lines, distribution networks, transformers, and EV charging infrastructure. In addition, AI data centers now demand substantially more power delivery and cooling infrastructure than traditional facilities. This adds a new, fast-growing source of demand. Consequently, grid modernization and data center buildouts are acting as simultaneous tailwinds rather than competing priorities.
Firms evaluating this electrification-driven demand for portfolio or coverage decisions can review RCK Analytics’ Energy and Utilities sector coverage for related grid and infrastructure analysis. The full report breaks down which end-markets, grid, EV, or data centers, contribute the most incremental copper demand growth through 2027.
Copper supply faces two separate constraints converging on the same record price. Global average copper ore grades have fallen from approximately 0.8% to 0.6% over the past two decades, and new mine permitting-to-production timelines now average 15 to 17 years. Chile holds approximately 18% of global supply, concentrating production risk, a risk reinforced this month by the Democratic Republic of Congo’s export ban.
The second constraint, however, is US trade policy, and its effect on price may be larger than the mine supply story, echoing the tariff-sensitive manufacturing and trade dynamics RCK Analytics tracked in its report on manufacturing strength masking selective economic weakness. Since Section 232 tariff proceedings began, COMEX-approved inventories have surged more than 550%, while LME inventories have fallen roughly 60% over the same period.
As a result, the COMEX-LME arbitrage has widened to a record spread above $2,600 per tonne. The full report quantifies how much of the current premium reflects physical scarcity versus stockpiling.
The current copper price rally is being driven by two forces that will not resolve on the same timeline. The electrification and AI infrastructure demand story is structural and multi-decade; it will not reverse even if near-term prices correct. The US stockpiling story, however, is largely policy-driven and could unwind quickly once the Commerce Department issues a final tariff determination, the same structural-versus-leveraged distinction RCK Analytics drew in its report on how AI’s leverage, not its underlying thesis, unwound in July 2026.
Similarly, positioning ahead of policy clarity has historically proven temporary once uncertainty resolves, meaning today’s elevated price could compress without reflecting a change in physical scarcity.
The full report outlines the specific signals, the Commerce Department’s tariff decision and Chinese import data, that will confirm or break this thesis over the next two quarters.
Copper hit a record $6.82 per pound as electrification demand collides with a decade of mine underinvestment but a 550% surge in US inventories shows tariff policy, not just scarcity, is driving the price.
Copper hit $6.70-$6.82 per pound on COMEX on August 5-6, 2026, driven by a combination of structural electrification demand and a tariff-driven US inventory buildup. CNBC notes the move reflects constrained supply and grid investment more than a broad economic acceleration.
AI data centers are a meaningful contributor, but not the sole driver. Electricity demand is rising roughly 3% annually toward 30,700 terawatt-hours by 2027 across data centers, EV charging, and grid modernization combined, a broader structural trend than any single end-market.
The Commerce Department’s refined copper cathode tariff decision was expected by mid-2026 but remained pending as of early August; the current proposal starts at 15% in January 2027, rising to 30% by 2028, per Capital.com’s tracking of the tariff timeline.
Not necessarily at current levels. Goldman Sachs Research estimates copper’s fundamental fair price closer to $11,500 per tonne and does not expect prices above $13,000 to be sustained, according to its own published analysis, implying part of today’s price reflects temporary stockpiling rather than permanent scarcity.
Share On




 info@rckanalytics.com
 +91 914 533 9262
 +91 (20) 46046669
 M 109 City Avenue, Shankar Kalat Nagar, Wakad, Pimpri-Chinchwad, Pune, Maharashtra, India - 411 057


Services
Sectors
Resources
Company
Copyright © 2026. RCK Analytics - All Rights Reserved.