
Whitepaper
6 min Read
26 Oct, 2026
Share On



The energy and utilities outlook for 2027 turns on one question: which assets can deliver power, not just promise demand? This weekly whitepaper examines the U.S. Energy & Utilities sector, where AI-driven load, record dealmaking and an oil-price shock now collide. Investors, strategic buyers and corporate planners must decide where to commit capital as electricity sales are forecast to reach 4,211 billion kilowatt-hours in 2027. RCK Analytics’ earlier whitepaper on AI energy demand, gas and nuclear set out the demand case. However, interconnection queues, permitting delays and equipment shortages can strand announced capacity, so demand growth is visible while connected, financed and recoverable returns remain uncertain.
The energy and utilities outlook points to a structural power-infrastructure cycle shaped by AI, data-centre expansion, manufacturing growth and rising electricity demand. U.S. electricity sales are forecast to rise from approximately 4,152 billion kilowatt-hours in 2026 to 4,217 billion in 2027, increasing requirements for generation, transmission, storage and grid modernisation.
Announced sector M&A reached $205 billion in the first half of 2026, concentrating capital in large transactions and operating generation. Brent crude averaged $114 per barrel in September, and rising gasoline and producer energy prices added to inflation pressure. As a result, value depends on converting electricity demand into operating assets rather than on growth forecasts or headline deal values.
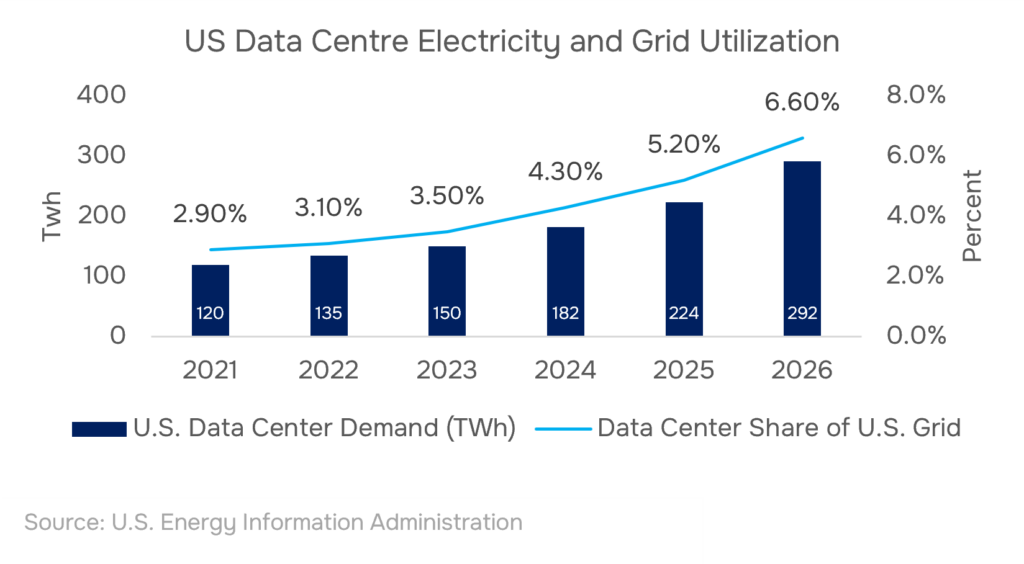
U.S. electricity demand is moving into a structural growth phase after years of modest expansion. The Energy Information Administration forecasts electricity sales of approximately 4,135 billion kilowatt-hours in 2026 and 4,211 billion in 2027, driven by data centers, advanced manufacturing and wider commercial activity. As a result, generation is also expected to reach new highs, which raises the need for dependable supply and network investment.
The opportunity extends beyond generation. Transmission lines, substations, transformers, grid-management software, battery storage and natural gas plants are becoming essential for connecting new loads. However, interconnection queues, permitting delays, equipment shortages and regional transmission limits can stop announced capacity from becoming operating supply. Planned data-center demand also does not always become contracted, connected consumption.
For utilities, independent power producers and infrastructure investors, access to deliverable electricity is becoming a competitive advantage. The strongest opportunities sit where contracted demand, existing grid connections and credible execution plans align, particularly across the Energy and Utilities sector. Capacity and reliability now shape where economic growth can occur.
The full report quantifies how gas-fired transaction valuations rose from $675 to $1,468 per kilowatt.
U.S. power and utilities M&A reached approximately $205 billion in announced transaction value across 92 deals in the first half of 2026, more than three times the comparable 2025 value. Two megadeals dominated: the proposed $124 billion NextEra Energy–Dominion Energy combination and the $48 billion AES take-private. Ten deals above $1 billion made up 97% of aggregate value, so consolidation is concentrated in large transactions. These figures reflect announced activity, not completed acquisitions.
Investor priorities are shifting from broad exposure to assets with identifiable capacity and operating cash flows. Natural gas accounted for 43% of the 97 gigawatts of generation capacity transacted in the first half, while solar represented 16% and nuclear 12%. Total capacity changing hands rose 38% year over year, and storage transactions exceeded six gigawatts.
Headline value alone is insufficient, because investors must separate enterprise value from equity value and announced deals from completed ones. Related analysis covers private capital rewriting AI infrastructure M&A. Teams screening power assets for acquisition can use RCK Analytics’ private equity and venture capital support team.
The full report breaks down September producer prices, including a 21.0% rise in diesel fuel
Geopolitical disruption can move crude prices, refined-product supply, transport costs and inflation at the same time. Brent crude averaged approximately $114 per barrel in September 2026, up $23 from August, after attacks on Middle Eastern energy infrastructure and tanker routes. As a result, supply security, inventories and dependable domestic production carry greater weight.
The inflation transmission is already visible. September consumer prices rose 0.6% month over month, and the Consumer Price Index rose 3.7% year over year. Gasoline prices increased 9.1% during the month, while the overall energy index rose 5.2%. At the producer level, final-demand prices rose 1.3% in September, and processed energy goods for intermediate demand increased 10.2%.
Because these measures capture different stages of the economy, energy costs can complicate the path toward lower inflation. Investors should therefore assess exposure by business model, because hedging, reserve quality, operating costs and refining margins decide who converts volatility into cash flow. Those factors shape the energy and utilities outlook, while sustained fuel-price increases raise costs for utilities and industrial consumers. See also the weekly macroeconomic report on CPI and PPI acceleration.
The full report covers 95% third-quarter refinery utilisation and distillate inventories 13% below their five-year average.
Entering 2027, the sector faces constructive demand drivers in data-centre expansion, manufacturing investment and electrification. Forecast growth does not guarantee equivalent returns, because new generation, transmission and distribution capacity must be financed, permitted and connected before demand becomes revenue. Data-centre announcements alone are insufficient; committed power agreements and funded infrastructure plans offer stronger evidence.
Capital markets reinforce this power infrastructure investment cycle, as $205 billion of announced first-half 2026 M&A shows investor demand for scale. Regulated utilities may benefit from approved grid investment and recoverable rate-base growth, while independent power producers can gain from tight supply. Renewables and storage add flexibility, but their economics depend on interconnection, financing and policy. Gas offers dispatchability, while nuclear may support reliable low-carbon supply where projects are viable.
Oil adds a less predictable dimension. If energy inflation persists, borrowing costs may stay restrictive and weaken capital-intensive project economics. Teams stress-testing project cash flows can use RCK Analytics’ financial modeling team. Investors should prioritise contracted demand, grid access, asset reliability and balance-sheet resilience, while monitoring permitting, interconnection queues, interest rates and regional power prices.
The full report includes an industry perspective on heat-wave strain on grid equipment from June 2026.
Returns in U.S. energy and utilities will depend on deliverable grid capacity, contracted demand, capital discipline and regulatory recovery rather than on electricity demand growth alone.
U.S. electricity sales are forecast to reach approximately 4,211 billion kilowatt-hours in 2027, up from 4,135 billion in 2026, according to the U.S. Energy Information Administration. This is a forecast, not realised demand, so connected capacity still decides which projects earn returns. Data centres, advanced manufacturing and commercial activity drive the increase.
The main risk is that the figure measures announced transaction value, not completed acquisitions, according to Deloitte Insights. Investors should also separate enterprise value from equity value and purchased assets from newly built capacity. Ten deals above $1 billion made up 97% of the total, so a few megadeals can distort the aggregate.
No, because the benefit of higher crude depends on business model, not on the headline price. Brent crude averaged $114 per barrel in September 2026, $23 above August, according to the U.S. Energy Information Administration. Upstream producers may gain from higher realised prices, while utilities and industrial consumers face higher costs.
Yes, energy can slow disinflation, according to the U.S. Bureau of Labor Statistics, which reported September consumer prices up 0.6% month over month and 3.7% year over year. Gasoline rose 9.1% and the energy index 5.2% in the month. Persistent energy inflation may keep borrowing costs restrictive for capital-intensive projects.
Download the full report to see gas-fired transaction valuations from $675 to $1,468 per kilowatt, September producer-price energy detail including diesel, and refinery utilization against distillate inventories.
Share On




 info@rckanalytics.com
 +91 914 533 9262
 +91 (20) 46046669
 M 109 City Avenue, Shankar Kalat Nagar, Wakad, Pimpri-Chinchwad, Pune, Maharashtra, India - 411 057


Services
Sectors
Resources
Company
Copyright © 2026. RCK Analytics - All Rights Reserved.