


Macroeconomy
6 min Read
07 Aug, 2026
Share On



This US macroeconomic report covers four releases between August 1 and August 6, 2026, that together reveal an economy showing strength on the surface and softness underneath. ISM Manufacturing PMI hit a four-year high, even as ISM Services employment fell into contraction, ADP reported the weakest private hiring in six months, and the US trade deficit narrowed on falling imports rather than rising exports. For institutional investors, IB, PE/VC, and credit research teams, this data lands two days ahead of the official July jobs report and directly informs Federal Reserve positioning heading into September.
Four releases between August 1 and August 6, 2026 revealed an economy sending mixed signals just two days ahead of July’s official jobs report. ISM Manufacturing PMI rose to 55.6 on August 1, a four-year high, while ISM Services Employment fell to 47.4 by August 5, back into contraction. ADP reported just 44,000 private-sector jobs added in July, the weakest gain in six months, while June JOLTS data showed openings little changed at 7.4 million. The US trade deficit narrowed to $73.3 billion in June, driven by falling imports rather than rising exports.
Meanwhile, S&P 500 Q2 2026 earnings growth accelerated to 47.4%, the fastest since 2021, though nearly half of that growth traced to two companies’ investment gains, including Amazon’s $53.4 billion gain tied to its stake in Anthropic.
Together, the data shows manufacturing strength alongside services and hiring caution, a narrowing trade gap driven by weaker imports, and a headline earnings number that overstates broad-based corporate strength, all landing just before the Fed’s next major labor data point.
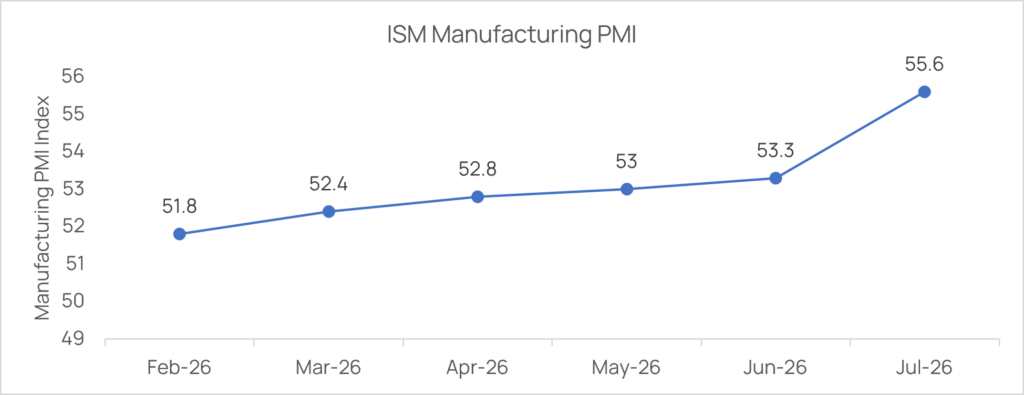
The Institute for Supply Management reported on August 1, 2026 that its Manufacturing PMI rose to 55.6 in July, up from 53.3 in June. That’s the strongest reading since May 2022, marking a seventh consecutive month of expansion. A reading above 50 signals sector growth.
Four days later, however, ISM’s Services report told a different story. The Services Employment Index fell to 47.4 in July from 51.2 in June, moving back into contraction even as new orders and business activity in services stayed firm. That divergence matters for how investors read sector-specific exposure heading into the second half of 2026.
Manufacturing’s strength has coincided with sustained business investment in AI infrastructure, a trend closely tracked within RCK Analytics’ Manufacturing sector coverage. Consequently, for teams assessing capital equipment demand or industrial supply chains, this week’s PMI report is a genuinely useful cross-check against last week’s Fed rate decision report, which flagged slowing GDP growth alongside still-elevated inflation.
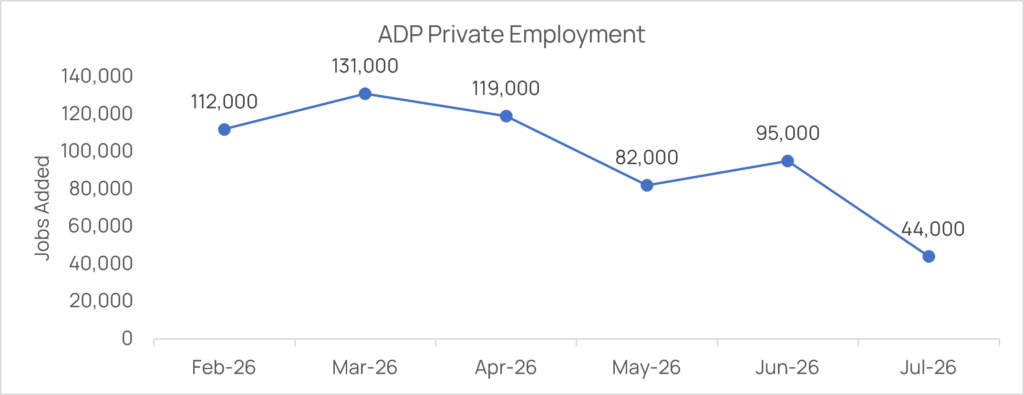
ADP Research reported on August 6, 2026 that private-sector employers added just 44,000 jobs in July, the smallest monthly gain in six months. That figure missed the 75,000 consensus forecast and fell well below June’s revised 95,000.
One day earlier, the Bureau of Labor Statistics reported that job openings were little changed at 7.4 million in June, down from a downwardly revised 7.5 million in May. Hires held steady at 5.3 million, and both the quits rate and layoffs rate stayed flat, at 2.0% and 1.1% respectively. As a result, economists describe current conditions as “low-hire, low-fire”: employers are neither expanding headcount aggressively nor cutting staff at scale.
This data lands two days ahead of the official July employment report, a release that will directly inform the Federal Reserve’s September 15-16 meeting, particularly following the three-way dissent in favor of a rate hike at the Fed’s July 29 decision, covered in last week’s US macroeconomic report. For credit research and workforce-dependent sectors like BFSI, this pre-print data is a meaningful early signal.
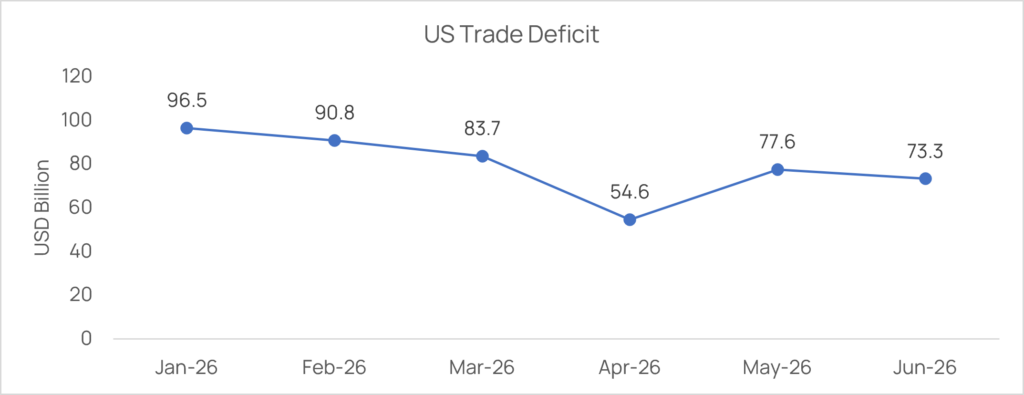
The US Census Bureau and Bureau of Economic Analysis reported on August 4, 2026 that the goods and services trade deficit narrowed to $73.3 billion in June, down $4.4 billion from a revised $77.6 billion in May. June exports totaled $314.7 billion, while imports totaled $388.0 billion, meaning the narrower deficit reflected falling imports more than rising exports.
Year-to-date through June, the deficit has decreased 33.8% compared to the same period in 2025, with exports up 11.7% but imports up just 0.4%. Import declines concentrated in capital goods and consumer goods, notably computers and pharmaceuticals.
For corporates managing cross-border supply chains, this divergence signals a structural shift in trade flows rather than a single-month fluctuation. RCK Analytics’ Strategic Consulting practice incorporates trade balance trends into supply chain and sourcing strategy for clients across Manufacturing sectors, where imported capital equipment and components remain a meaningful cost driver.
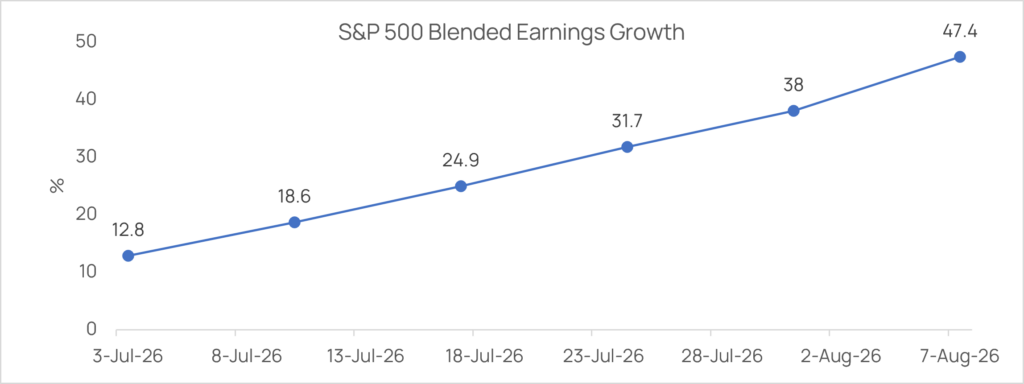
As of July 31, 2026, with 61% of S&P 500 companies having reported second-quarter results, the index’s blended earnings growth rate stood at 47.4%, up sharply from 38.0% the prior week. That’s the highest year-over-year growth rate since Q2 2021’s 91.6%.
Two companies drove most of the acceleration. Amazon reported earnings per share of $5.75 against a $1.82 estimate, boosted by a $53.4 billion pre-tax gain tied to its investment in Anthropic. Alphabet reported earnings per share of $9.11 against a $2.88 estimate, boosted by a $98.0 billion gain on equity securities. Excluding these two companies, the growth rate falls to 28.8%, still strong, but materially different from the headline figure.
For portfolio managers and PE/VC sponsors evaluating sector-level valuation, this gap underscores the value of examining earnings composition rather than relying on index-level growth alone. RCK Analytics’ Investment Research team factors this kind of concentration risk into sector allocation models, a theme explored further in the firm’s Q2 2026 S&P 500 EPS sector analysis whitepaper.
Manufacturing hit a four-year high while services hiring contracted, ADP job growth slowed sharply, the trade deficit narrowed on weaker imports, and Amazon’s Anthropic stake drove nearly half of Q2 earnings growth.
Divergence between the two indices is not unusual, but a manufacturing expansion at a four-year high alongside a services employment contraction is a notable gap. It suggests business investment, potentially AI-related capital spending, is flowing more into manufacturing output than services hiring. (Source: Institute for Supply Management, July 2026 ISM Manufacturing PMI Report)
Not necessarily. June 2026’s narrower $73.3 billion deficit resulted from imports falling faster than exports grew, which can reflect softer domestic demand rather than stronger export competitiveness. Analysts typically distinguish between deficit narrowing driven by export growth versus import weakness. (Source: U.S. Census Bureau & Bureau of Economic Analysis, U.S. International Trade in Goods and Services, June 2026)
Amazon and Alphabet accounted for the bulk of the increase, with the index’s blended growth rate falling from 47.4% to 28.8% when both companies are excluded. Both companies’ results were boosted by large non-operating investment and equity gains rather than core operating performance alone. (Source: FactSet, S&P 500 Earnings Season Update, July 31, 2026)
ADP data is directionally useful but has historically diverged from BLS nonfarm payrolls in magnitude, since the two surveys use different methodologies and samples. July’s ADP reading of 44,000 jobs signals hiring caution but should be read alongside JOLTS and other labor indicators rather than as a standalone forecast. (Source: ADP Research, National Employment Report, August 2026)
Share On




 info@rckanalytics.com
 +91 914 533 9262
 +91 (20) 46046669
 M 109 City Avenue, Shankar Kalat Nagar, Wakad, Pimpri-Chinchwad, Pune, Maharashtra, India - 411 057


Services
Sectors
Resources
Company