
Macroeconomy
5 min Read
11 Sep, 2026
Share On



This US macroeconomic report covers four developments between September 2 and September 10, 2026, giving the Federal Reserve a genuinely complex setup five days before its September 15-16 policy meeting. August payrolls tripled consensus forecasts, PPI accelerated on energy costs, the Beige Book showed modest nationwide growth with tariff cost pass-through, and political commentary touched directly on trade and monetary policy. This builds on the hawkish sentiment flagged in the Fed’s rate-hike debate report from the prior week.
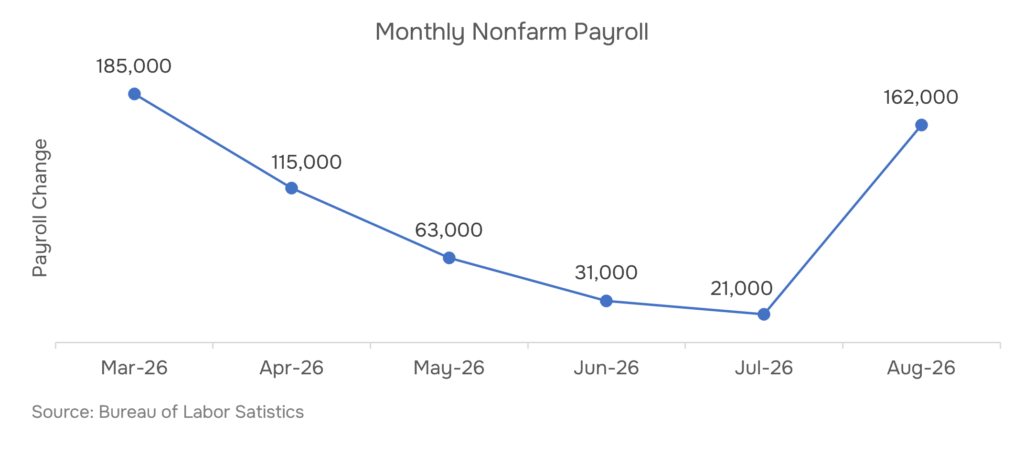
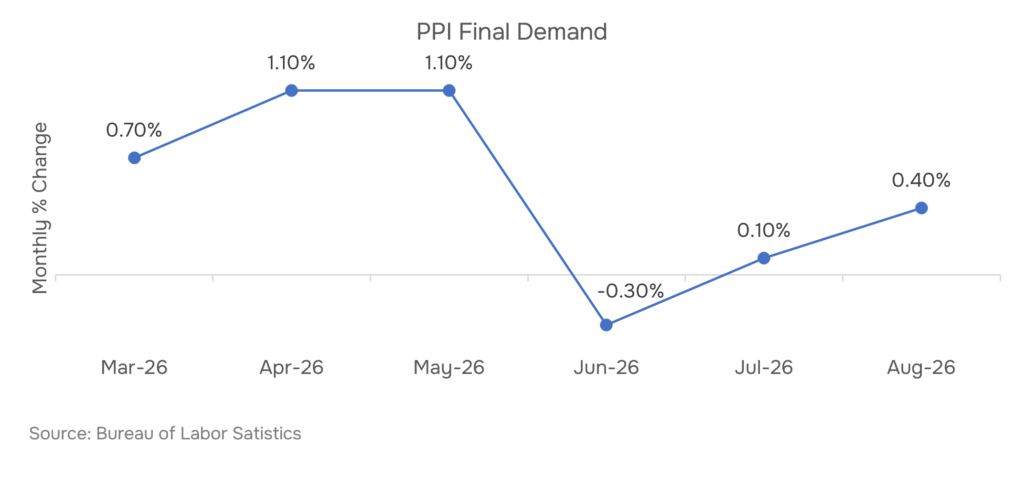
Four releases between September 2 and September 10, 2026 provided Federal Reserve a range of data points to weigh five days before its September 15-16 policy meeting. August nonfarm payrolls rose to 162,000 from a revised 21,000 in July, more than triple consensus, with average hourly earnings climbing to $37.75. August PPI rose 0.4% month-over-month, driven largely by a 4.2% increase in energy costs, including double-digit gains in jet fuel, home heating oil, and diesel.
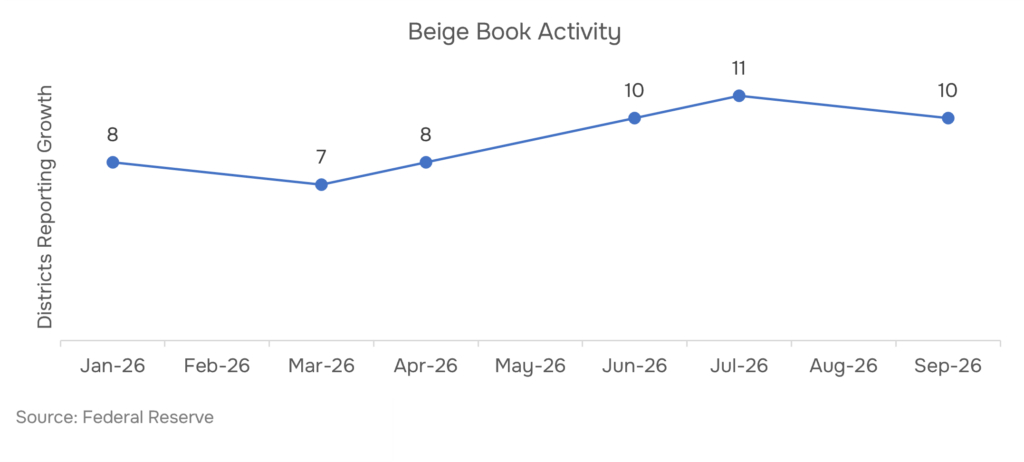
The Federal Reserve’s September 2 Beige Book showed ten of twelve districts reporting modest growth, with data center demand cited as a key driver, while several districts reported manufacturers passing tariff-related costs to consumers. Alongside this data, political commentary touched on trade policy tied to rate decisions, and a midterm convention pledge referenced a $1.8 trillion year-to-date federal deficit as relevant context. Together, the data and commentary this week span labor market strength, energy-driven inflation pressure, and political dynamics ahead of the Fed’s meeting.
The U.S. Bureau of Labor Statistics reported on September 4, 2026 that nonfarm payrolls rose by 162,000 in August, more than triple the 53,000 consensus forecast and the strongest monthly gain since March. The unemployment rate held steady at 4.1%, unchanged from July.
June and July payroll figures were revised up by a combined 55,000, with July moving from an originally reported loss of 23,000 jobs to a gain of 21,000. Food Services and Drinking Places led the expansion, adding 59,200 jobs, while Local Government Education rebounded with 41,900 jobs added. Manufacturing and Construction continued an upward trajectory, adding 16,000 and 22,000 jobs respectively, consequently reinforcing a theme relevant to RCK Analytics’ Manufacturing sector coverage.
Average hourly earnings rose 0.3% month-over-month, or 10 cents, to $37.75, pulling annual wage growth to 3.1%. As a result, this beat factored directly into market-implied expectations for the Federal Reserve’s September 15-16 meeting, a dynamic RCK Analytics’ Investment Research team is tracking alongside the hawkish sentiment covered in last week’s rate-hike debate report.
The U.S. Bureau of Labor Statistics reported on September 10, 2026 that the Producer Price Index for final demand rose 0.4% month-over-month in August, in line with consensus and an acceleration from July’s revised 0.1% gain. On an annual basis, PPI rose 5.4%, 0.1 percentage point above expectations.
Final demand goods prices rose 1.1%, driven substantially by a 4.2% increase in energy costs, with jet fuel up 21%, home heating oil up 22%, and diesel up 23%. Final demand services prices rose a more modest 0.1%, led by transportation services, up 2.3%. Meanwhile, core PPI, excluding food and energy, rose 0.2%, below the 0.3% consensus forecast.
This energy-concentrated cost pressure is a theme RCK Analytics’ Energy and Utilities sector coverage tracks closely, particularly given the report’s alignment with tariff-driven cost pass-through described in the Copper Price Rally whitepaper.
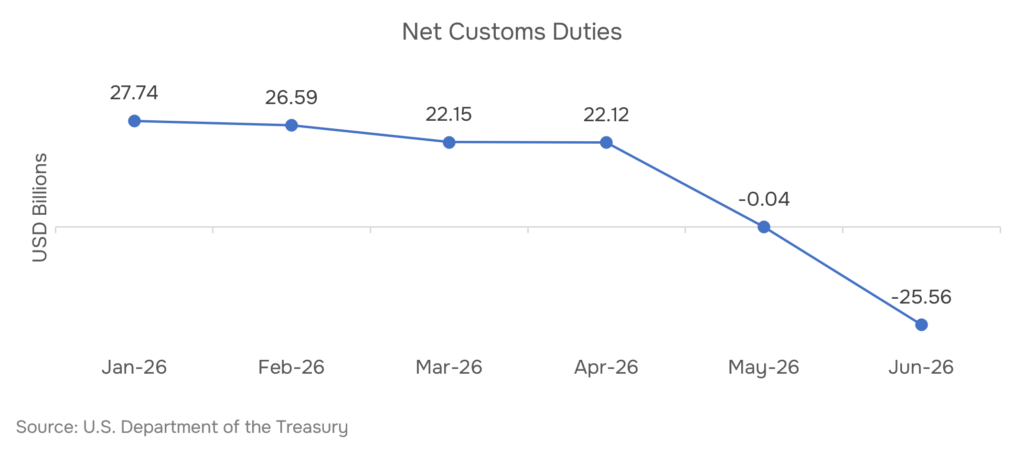
Following the release of the August jobs report on September 4, 2026, President Trump stated that the Federal Reserve should cut interest rates, adding that he would halt trade with countries running a trade surplus with the United States if it did not, citing a recent Supreme Court ruling on tariff authority as the basis for that option.
Five days later, at the Republican Party’s midterm convention in Dallas on September 9-10, 2026, Trump told attendees that if Republicans retained control of both the House and Senate following the November 3 election, his administration would issue a $5,000 dividend to every adult American citizen, funded, he said, by tariff revenue. Independent fact-checkers reported the federal government has spent approximately $1.8 trillion more than it has collected in fiscal year 2026 through the date of the speech.
Consequently, both statements arrived in the same week as the payroll and PPI data above, a dynamic RCK Analytics’ Credit Research team is factoring into rate-sensitive positioning ahead of September 15-16.
The Federal Reserve released its Beige Book on September 2, 2026, reporting that national economic activity increased modestly since early July, based on information collected through August 24. Ten of the twelve Federal Reserve Districts reported growth in the slight-to-moderate range, while two districts reported no change.
Demand from data centers was cited across multiple districts as a driver of manufacturing and nonfinancial services growth, a trend explored further in RCK Analytics’ AI Architecture Gap whitepaper. Auto sales were broadly subdued, attributed to weak consumer confidence, elevated fuel prices, and rising financing costs. Notably, several districts reported manufacturers and retailers raising prices specifically to cover tariff-related input costs, with one large retailer noting petroleum-based product costs rose more than 20%.
This anecdotal evidence of cost pass-through aligns with Section 2’s PPI data above, adding useful context ahead of the Fed’s September 15-16 meeting.
US growth is moderating while inflation stays sticky and energy risk builds, leaving an increasingly hawkish Federal Reserve confronting a labour market that is cooling faster than prices are falling.
Revisions matter most when they change the trend direction, as seen in August 2026: July’s initial reading of a 23,000 job loss was revised to a 21,000 gain, a swing large enough to shift the overall reading of summer labor market conditions rather than simply adjusting the magnitude of an already-known trend. (Source: U.S. Bureau of Labor Statistics, The Employment Situation, August 2026)
Yes, the two can coexist, as August-September 2026 showed: the Beige Book described modest overall growth across most districts, while several districts simultaneously reported manufacturers raising prices specifically to offset tariff-related input costs, a supply-side cost dynamic that doesn’t require weak demand to occur. (Source: Federal Reserve, Beige Book, September 2, 2026)
Yes. August 2026’s PPI data showed final demand goods prices rising 1.1%, driven almost entirely by energy components, jet fuel, home heating oil, and diesel, while core PPI excluding food and energy rose a more modest 0.2%, below consensus, indicating the acceleration was concentrated rather than broad-based. (Source: U.S. Bureau of Labor Statistics, Producer Price Index, August 2026)
The risk lies in ignoring the broader revision pattern: August 2026’s 162,000 gain followed a period of downward revisions to prior months, so a single strong print should generally be weighed alongside the trend of recent revisions rather than treated as a standalone confirmation of labor market strength. (Source: U.S. Bureau of Labor Statistics, The Employment Situation, August 2026)
Share On




 info@rckanalytics.com
 +91 914 533 9262
 +91 (20) 46046669
 M 109 City Avenue, Shankar Kalat Nagar, Wakad, Pimpri-Chinchwad, Pune, Maharashtra, India - 411 057


Services
Sectors
Resources
Company
Copyright © 2026. RCK Analytics - All Rights Reserved.