


Macroeconomy
6 min Read
14 Aug, 2026
Share On



This US macroeconomic report covers four releases between August 7 and August 13, 2026, that together show an economy cooling on multiple fronts simultaneously. July nonfarm payrolls fell 23,000, with May and June revised down a combined 103,000, while CPI eased to 3.4% annually and crude oil inventories posted their largest weekly build since January 2023. This data extends the sector-divergence theme raised in last week’s manufacturing strength report, where labor softness first appeared alongside otherwise resilient headline data.
Four releases between August 7 and August 13, 2026 revealed a US economy cooling on multiple fronts at once. July nonfarm payrolls fell by 23,000, with May and June revised down a combined 103,000, though jobless claims rose only modestly to 209,000 the following week, suggesting the weakness hasn’t deepened further. CPI eased to 3.4% annually while PPI held flat month-over-month, both pointing toward continued disinflation, though core price pressure in shelter and services remains sticky.
Crude oil inventories posted their largest weekly build since January 2023, up 17.4 million barrels, driven by a sharp drop in exports tied to ongoing Strait of Hormuz disruptions. Existing-home sales fell 1.7% in July as the 30-year mortgage rate climbed to a 2026 high of 6.69%, even as the median home price set its 37th consecutive monthly record. Together, the data shows a labor market that stumbled in July without collapsing, inflation still cooling but not resolved, an oil market absorbing a geopolitically driven supply shift, and a housing sector caught between record prices and rising borrowing costs.
The Bureau of Labor Statistics reported on August 7, 2026 that nonfarm payrolls fell by 23,000 in July, missing a consensus estimate for a gain of roughly 83,000 to 95,000 jobs. May and June payroll gains were revised down by a combined 103,000, from 129,000 to 63,000 for May and from 57,000 to 20,000 for June.
The unemployment rate ticked down to 4.1% from 4.2% in June, though the decline traced to a shrinking labor force rather than stronger hiring. The labor force participation rate fell to 61.4%, its lowest level in more than five years, and average hourly earnings rose just 2 cents, pulling 12-month wage growth down to 3.2%, the lowest since May 2021.
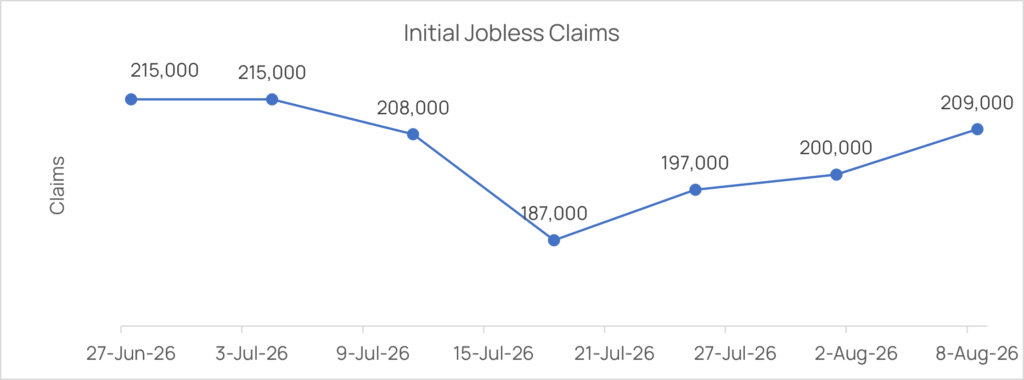
One week later, on August 13, 2026, the Department of Labor reported that initial jobless claims rose by 9,000 to 209,000 for the week ended August 8, above consensus and up from a revised 200,000 the prior week. Consequently, this labor market data lands directly ahead of the Federal Reserve’s September 15-16 meeting, a dynamic RCK Analytics’ Investment Research practice is tracking alongside the sector divergence flagged in last week’s manufacturing report.
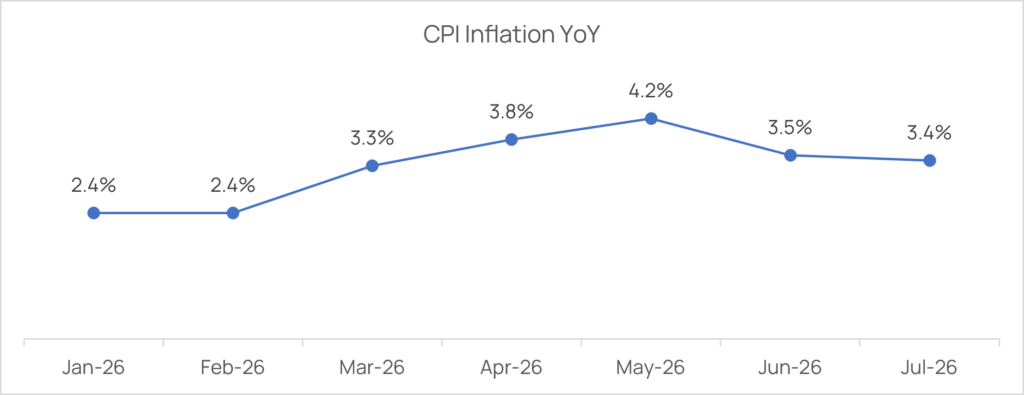
The Bureau of Labor Statistics reported on August 12, 2026 that the Consumer Price Index rose 0.1% month-over-month in July, rebounding from a 0.4% decline in June. The annual rate eased to 3.4% from 3.5%, the second consecutive monthly slowdown. Core CPI, excluding food and energy, rose 0.2% for the month, with the annual core rate easing to 2.5% from 2.6%.
Energy prices fell 1.5% in July, while shelter rose 0.1% and accounted for roughly two-thirds of the headline monthly increase. One day later, however, the Bureau reported that the Producer Price Index for final demand was unchanged in July, following a 0.1% decline in June. Final demand goods prices fell 0.7%, while final demand services rose 0.2%. On an annual basis, PPI rose 4.7%.
Both releases point in the same direction: inflation is cooling, but core price pressure remains sticky enough to keep the Federal Reserve’s 2% target out of reach. As a result, RCK Analytics’ Credit Research team continues to weigh sticky shelter and services components against headline disinflation when assessing rate-sensitive credit exposure.
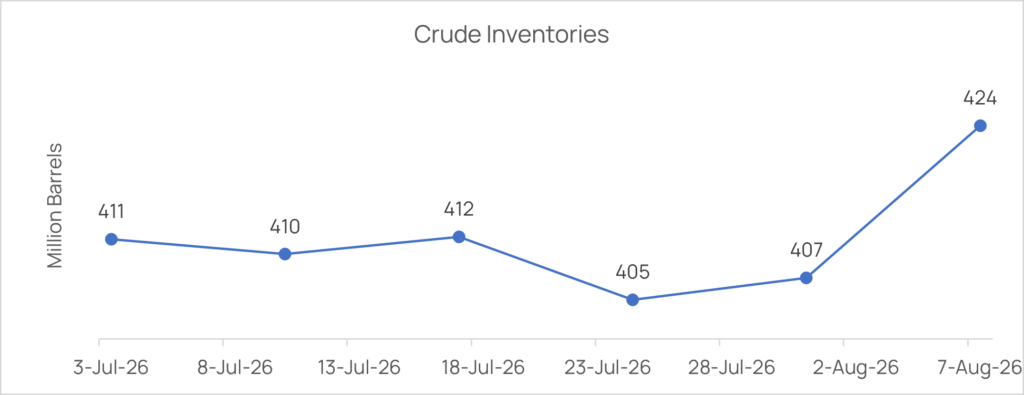
The U.S. Energy Information Administration reported on August 13, 2026 that commercial crude oil inventories, excluding the Strategic Petroleum Reserve, rose by 17.4 million barrels for the week ended August 7, the largest weekly build since January 2023. The increase came in sharply against analyst expectations for a draw of roughly 1.4 million barrels.
The build was driven primarily by a jump in crude imports, which rose to 7.3 million barrels per day, alongside a drop in exports to 3.06 million barrels per day, the lowest level since November 2025. Meanwhile, the EIA’s Short-Term Energy Outlook, released August 11, 2026, cited continued constraints on Strait of Hormuz transits as a factor keeping regional crude production below pre-conflict levels.
For clients tracking commodity-exposed portfolios, this supply-side shift reinforces themes explored in RCK Analytics’ Copper Price Rally whitepaper, which examines how geopolitical disruption and stockpiling behavior distort commodity price signals. RCK Analytics’ Energy and Utilities sector coverage incorporates this data into ongoing client positioning.
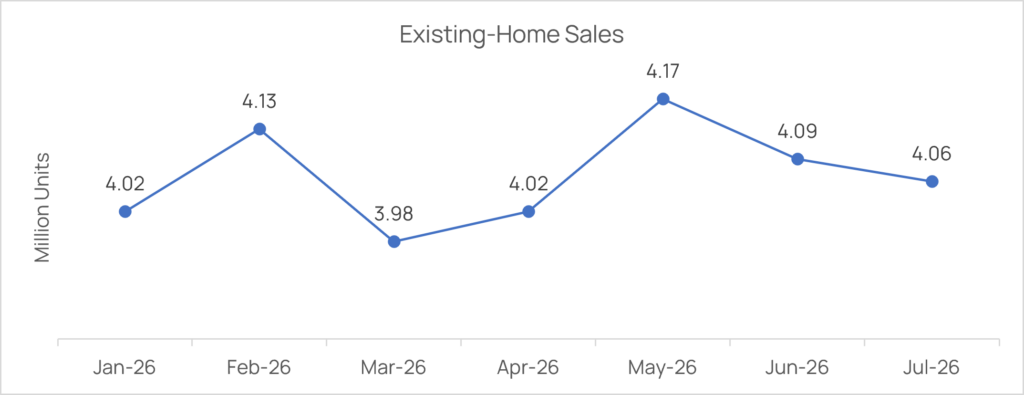
The National Association of Realtors reported on August 11, 2026 that existing-home sales fell 1.7% month-over-month in July to a seasonally adjusted annual rate of 4.06 million, marking a second consecutive monthly decline, though sales remained 0.7% higher than a year earlier. The median existing-home price rose to a record $434,100, the 37th consecutive month of year-over-year price gains.
Inventory fell to 1.54 million units, representing 4.6 months of supply. The sales slowdown coincided with a rising mortgage rate environment: Freddie Mac’s Primary Mortgage Market Survey put the 30-year fixed rate at 6.69% for the week ending August 6, 2026, a fifth consecutive weekly increase and the highest level recorded in 2026.
Despite higher rates, however, NAR’s Housing Affordability Index improved to 103.3, up from 98.3 a year earlier. First-time buyers accounted for 29% of July transactions, roughly in line with a year ago, indicating affordability gains are not yet translating into a sales rebound.
Payrolls fell 23,000 with steep revisions, inflation eased to 3.4%, crude inventories posted their largest build since 2023, and home sales slowed as mortgage rates hit a 2026 high.
Large combined revisions, such as July 2026’s 103,000 downward adjustment to May and June, often shift market expectations more than a single month’s headline number because they reveal a trend understated in real time. Analysts generally weigh revisions heavily when they exceed 100,000 combined, as occurred this week. (Source: U.S. Bureau of Labor Statistics, The Employment Situation, July 2026)
Not necessarily. August 2026’s 17.4 million barrel build resulted primarily from an export collapse tied to Strait of Hormuz disruptions rather than weaker demand, a distinction the EIA’s own outlook flagged as a factor supporting elevated Brent prices despite the build. (Source: U.S. Energy Information Administration, Weekly Petroleum Status Report)
The rate fell to 4.1% from 4.2%, but the decline was driven by a shrinking labor force, participation fell to a five-year low of 61.4%, rather than stronger hiring. Reading the rate alone without checking participation risks overstating labor market health. (Source: U.S. Bureau of Labor Statistics, The Employment Situation, July 2026)
Yes, as July 2026 demonstrated: the median existing-home price hit a record $434,100 even as the 30-year mortgage rate climbed to a 2026 high of 6.69% and sales fell 1.7%. Limited inventory can sustain price growth even as higher borrowing costs suppress transaction volume. (Source: National Association of Realtors, Existing-Home Sales, July 2026)
Share On




 info@rckanalytics.com
 +91 914 533 9262
 +91 (20) 46046669
 M 109 City Avenue, Shankar Kalat Nagar, Wakad, Pimpri-Chinchwad, Pune, Maharashtra, India - 411 057


Services
Sectors
Resources
Company