
Macroeconomy
6 min Read
04 Sep, 2026
Share On



This US macroeconomic report covers the week of August 28 to September 4, 2026, a stretch in which the policy debate shifted faster than the data did. Federal Reserve Chair Kevin Warsh used his Jackson Hole keynote to reopen the case for tightening. Meanwhile, four releases showed manufacturing cooling, hiring decelerating, and diesel costs near record levels. Last week’s report on stalled core PCE progress left September policy as an open question. Warsh answered it directly. For deal teams, credit desks, and portfolio managers, the financing calculus has changed.
Four releases between September 1 and September 3, 2026 describe a US economy expanding at a decelerating pace, with inflation risk skewed upward. The ISM Manufacturing PMI eased to 54.6% in August from 55.6%, an eighth consecutive expansion. Meanwhile, the Services PMI held at 55.4% for a twenty-sixth straight month, while its Prices Index at 71.1% signalled unresolved input cost pressure.
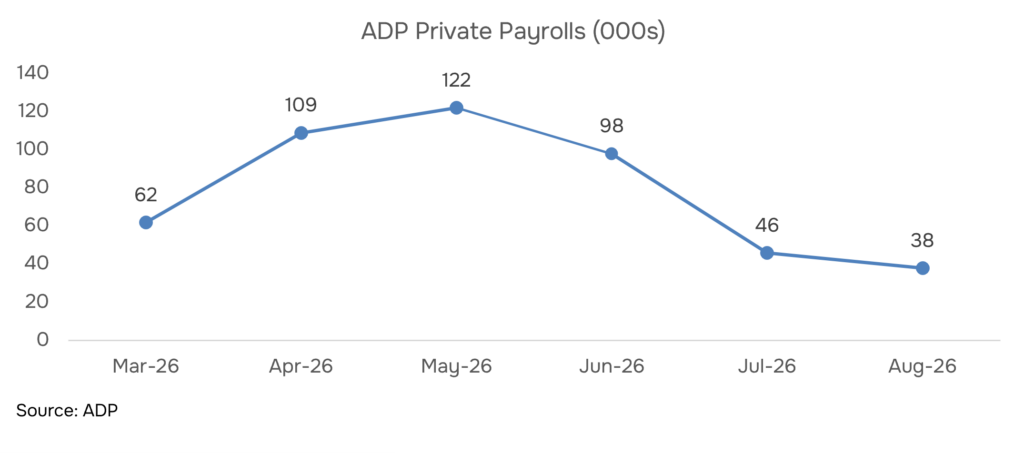
Labour demand is plateauing. July job openings totalled 7.271 million against a downwardly revised 7.182 million, hires fell 294,000, and the quits rate sat at a 1.9% post-pandemic floor. In addition, August ADP private payrolls added only 38,000 versus 47,000 expected. Initial jobless claims rose to 206,000 for the week ended August 29, confirming low firing rather than genuine contraction.
Against this backdrop, Chair Kevin Warsh’s August 28 Jackson Hole keynote reaffirmed the 2% target and disputed that current policy is restrictive. Consequently, market-implied September hike odds reached 66%. Diesel peaked at $5.652 per gallon on August 24, sustaining a supply-side inflation impulse the Federal Reserve must weigh on September 15–16.
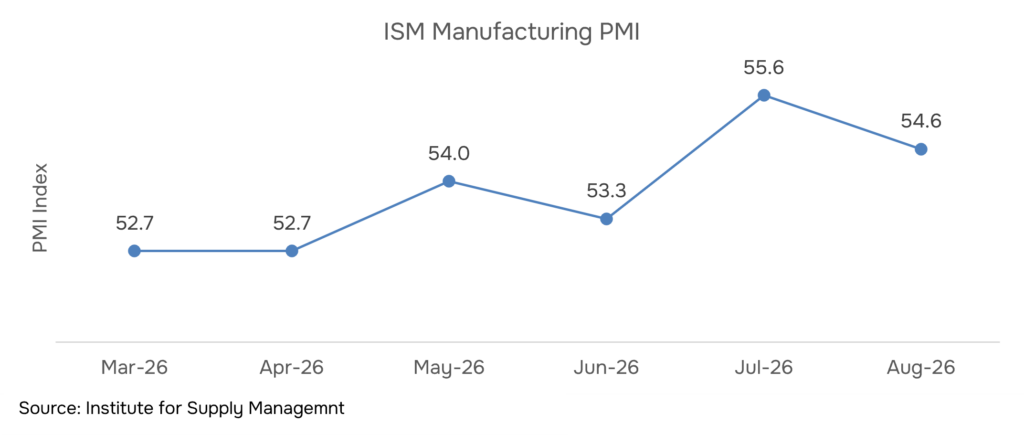
The ISM Manufacturing PMI registered 54.6% in August 2026, according to the September 1 release. That marked a 1.0-point decline from July’s 55.6% and undershot the 55.2% consensus. Nevertheless, the index held above 50 for an eighth straight month, extending a recovery that began after a ten-month contraction.
Beneath the headline, demand indicators softened. New Orders fell to 53.7% from 56.7%. Backlog of Orders dropped 3.2 points to 51.8%, while Employment slipped 1.6 points to 51.2%. Meanwhile, Production held firm at 58.3%, down just 0.2 point. Supplier Deliveries rose 0.4 point to 59.3%, which signals lengthening lead times. Notably, the Prices Index stayed at 71.1%, unchanged from July.
The September 3 Services PMI told a steadier story at 55.4%, a twenty-sixth consecutive month of expansion. That reading sat 1.7 points above its twelve-month average of 53.7%. Twelve industries reported growth against five contracting. As a result, the broader economy has now expanded for twenty-two straight months.
However, order books matter more than headline levels for capacity planning. A three-point drop in new orders alongside sticky input prices compresses forward margins. RCK Analytics incorporates these subindex movements into its Manufacturing sector coverage for clients modelling 2027 capacity commitments.
The July JOLTS report, released September 1, showed job openings at 7.271 million. Openings rose 89,000 month-over-month, and the openings rate held steady at 4.4%. However, that gain starts from a lower base, because June was revised down 177,000 to 7.182 million. Roughly 1.1 vacancies now exist per unemployed worker.
Internals proved softer than the headline suggested. Hires fell 294,000 to 5.054 million. Consequently, the hiring rate dropped from 3.4% to 3.2%, its weakest level since February 2026. Professional and business services alone shed 188,000 hires. Meanwhile, quits fell 157,000 to 3.056 million, holding the quits rate at a 1.9% post-pandemic floor. Layoffs declined 100,000 to 1.666 million, a 1.0% rate.
The September 2 ADP report reinforced the deceleration. Private payrolls added just 38,000 in August against a 47,000 consensus, the softest reading since January. Education and health services contributed 45,000, while manufacturing shed 17,000. In addition, initial jobless claims rose to 206,000 for the week ended August 29, up 2,000 on the week.
Employers are neither cutting nor hiring at scale. Similarly, deal models built on 2025 headcount assumptions now require revision, a theme RCK Analytics’ Investment Research team tracks across sector coverage.
The forty-ninth Jackson Hole Economic Policy Symposium convened August 27 to 29 in Wyoming, under the theme Financial Innovation: Implications for Payments and Policy. Chair Kevin Warsh delivered the keynote on August 28, his hundredth day in office. Roughly 120 central bankers attended.
Warsh reaffirmed 2% PCE inflation as a firm, fixed target. He cited twelve-month and six-month PCE readings of 3.7% and 4.1% respectively. Notably, he disputed the premise that policy is already restrictive, saying he would be hard pressed to characterise broad financial conditions as tight. Consistent with his aversion to forward guidance, he declined to commit to any timing.
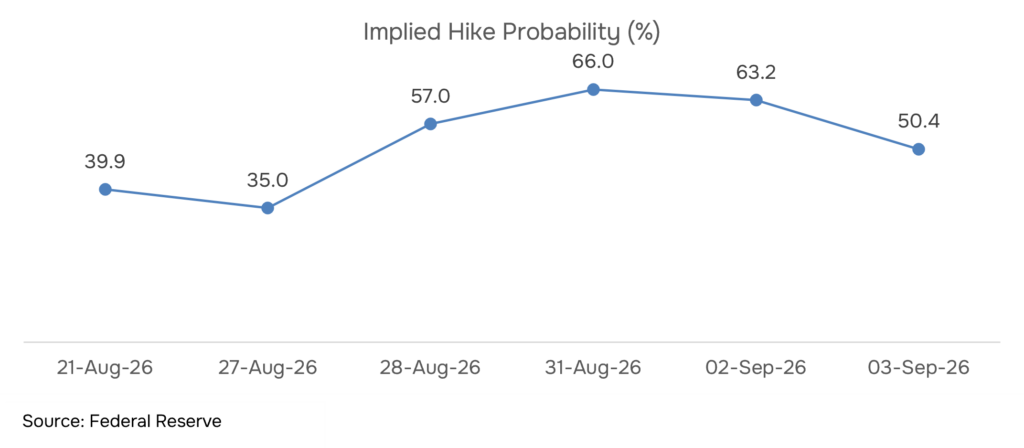
Markets repriced quickly. Market-implied odds of a September quarter-point hike stood at 39.9% on August 21 and near 35% immediately pre-speech. They jumped to 57% on August 28, then peaked at 66% on August 31. However, softer payroll data trimmed pricing to 63.2% by September 2. Governor Christopher Waller’s September 3 remarks pared it further to 50.4%.
The funds rate remains at 3.50–3.75%. Consequently, the September 15–16 decision now turns almost entirely on incoming inflation prints, a repricing dynamic examined further in Markets Reprice Confidence Before Credit Risk.
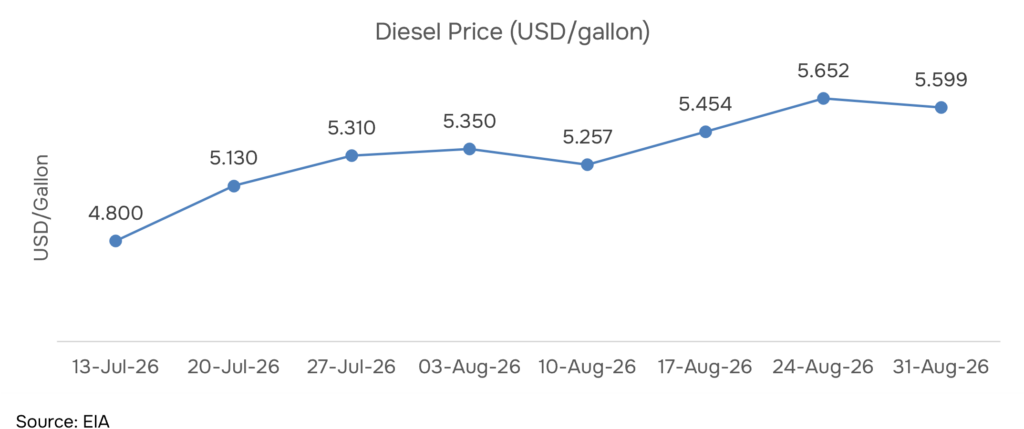
Distillate costs remain the sharpest inflation transmission channel into US industry. The national on-highway diesel average climbed from $5.257 per gallon on August 10 to $5.454 on August 17. It then reached $5.652 on August 24, the highest weekly print of 2026. Prices eased slightly to $5.599 on August 31.
That August 24 peak sat roughly $0.16 below the June 2022 record of $5.81. Moreover, the August 31 level ran $1.865 above the comparable 2025 week. Regional dispersion widened sharply. California reached $7.218 and the West Coast $6.497, while the Lower Atlantic held at $5.276. As a result, refining constraints, not crude alone, explain much of the distillate premium.
Geopolitics compounded the pressure. The June 17 memorandum of understanding between Washington and Tehran collapsed by July 8. Subsequently, the sixty-day ceasefire lapsed in late August without extension. Strait of Hormuz transit rights remain unresolved, which sustains a persistent risk premium in crude.
Freight, agriculture and manufacturing margins absorb this cost directly, rather than discretionary household spending. RCK Analytics’ Energy and Utilities coverage and its AI energy demand whitepaper examine how sustained fuel costs reshape industrial cost structures.
US growth is moderating while inflation stays sticky and energy risk builds, leaving an increasingly hawkish Federal Reserve confronting a labour market that is cooling faster than prices are falling.
A reading of 54.6% still indicates expansion, since any figure above 50 signals growth. The risk lies in conflating deceleration with contraction: August marked an eighth consecutive expansionary month, even as the pace eased from July’s 55.6%. Forward-looking subindexes such as New Orders, which fell to 53.7%, carry more predictive weight than the headline. (Source: Institute for Supply Management, ISM Report On Business)
Market-implied odds peaked at 66% on August 31 following Chair Warsh’s hawkish Jackson Hole keynote, then declined to 50.4% by September 3. Softer labour data and subsequent remarks from Governor Christopher Waller drove the retracement. These figures reflect fed funds futures pricing, not Federal Reserve guidance, and can move sharply on a single data release. (Source: U.S. Bureau of Labor Statistics, Current Employment Statistics)
The national on-highway diesel average reached $5.599 per gallon for the week of August 31, 2026, which is $1.865 above the comparable week in 2025. The August 24 peak of $5.652 came within roughly $0.16 of the June 2022 record of $5.81 per gallon. Regional prices vary widely, from $5.276 in the Lower Atlantic to $7.218 in California. (Source: U.S. Energy Information Administration, Weekly Petroleum Status Report)
The hires rate offers a clearer signal than job openings or layoffs. It fell from 3.4% to 3.2% in July 2026, its weakest reading since February, while layoffs simultaneously declined to a 1.0% rate. That combination defines a low-fire, low-hire market, where employers retain staff without adding to headcount. Initial claims at 206,000 for the week ended August 29 corroborate the pattern. (Source: U.S. Department of Labor, Unemployment Insurance Weekly Claims)
Share On




 info@rckanalytics.com
 +91 914 533 9262
 +91 (20) 46046669
 M 109 City Avenue, Shankar Kalat Nagar, Wakad, Pimpri-Chinchwad, Pune, Maharashtra, India - 411 057


Services
Sectors
Resources
Company
Copyright © 2026. RCK Analytics - All Rights Reserved.