
Whitepaper
4 min Read
07 Sep, 2026
Share On



This Whitepaper, part of our Investment Research series, covers why the S&P 500’s approximately 22% rally since March 30, 2026 is entering a structurally different phase. Four independent sources of market support, corporate buybacks, retail demand, pension flows, and options positioning, are each fading for calendar-driven reasons in the same three-week window this September. Layered on top, September has closed lower more often than any other month since 1928, a pattern that has historically tripled in midterm-election years like 2026. However, downside protection remains historically inexpensive, creating a specific, time-boxed opportunity rather than a signal to exit markets broadly.
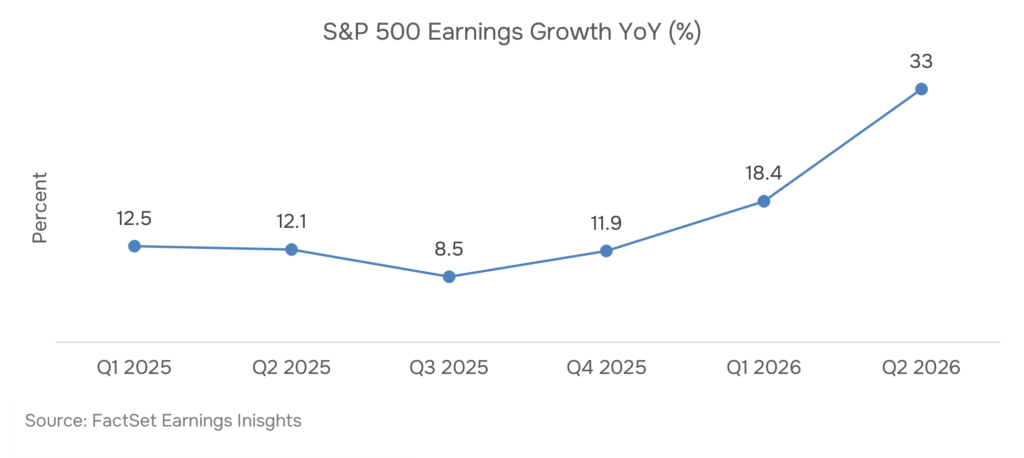
The S&P 500’s approximately 22% advance since its March 30, 2026 low, adding roughly $12 trillion in market capitalization, was driven by verifiable fundamentals: 88% of reporting S&P 500 companies beat second-quarter 2026 EPS estimates by a median 7%, while corporate buyback authorizations exceeding $1.1 trillion entered an open repurchase window.
However, four independent sources of that support are scheduled to contract simultaneously in September 2026: buyback blackout periods beginning around September 12, historically weak retail participation, pension fund de-risking tied to 112% funded status, and approximately $9.6 trillion in options exposure expiring by September 18. Since 1928, September has closed lower more often than any other month, a pattern that has historically tripled in midterm-election years like 2026.
The S&P 500 has risen approximately 22% since its March 30, 2026 low, adding roughly $12 trillion in market capitalization through late August 2026. As of August 31, 2026, 93% of S&P 500 companies by market weight had reported second-quarter results, with 88% beating consensus EPS estimates by a median margin of 7%, while only 12% missed, and those misses averaged just 3%.
Corporate buying activity reinforced the earnings strength. More than $1.1 trillion in authorized share buybacks moved into an open repurchase window through August 2026, and 67% of the largest authorized buybacks in 2026 originated outside the technology sector. Firms tracking these structural flows can review RCK Analytics’ Market Intelligence service for ongoing positioning and liquidity analysis.
The full report identifies which specific sectors captured the largest share of that buyback demand, beyond the technology-outside split.
Four distinct sources of market support are set to contract at the same time in September 2026. Each fades for calendar-driven reasons, not sentiment. Corporate buyback authorizations enter blackout periods ahead of third-quarter earnings. These restrictions accelerate starting around September 12, 2026. Meanwhile, retail investor participation is historically the weakest of any calendar month in September. Analysts expect it to register the lowest share of annual retail net buying.
Additionally, the largest 100 US corporate pension plans stood at approximately 112% funded status as of late August 2026. That’s the highest level since 2001. This creates a mechanical incentive to reduce equity exposure into quarter-end. That deleveraging dynamic echoes the systematic unwind RCK Analytics examined in its whitepaper on how AI’s leverage, not its underlying thesis, unwound in July 2026.
The full report breaks down how much dealer positioning shifts once the $9.6 trillion options expiration clears on September 18.
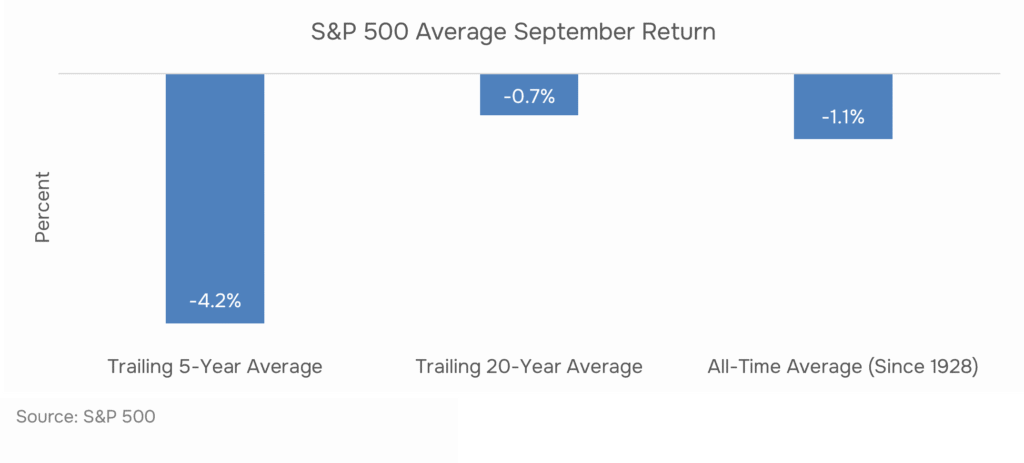
Since 1928, the S&P 500 has closed the month of September lower in 55% of all years. That’s the only calendar month with a negative-more-often-than-positive record. The average September return is negative 1.1%. The average intra-month selloff runs negative 4.7%. This pattern concentrates across capital-intensive sectors tracked in RCK Analytics’ TMT sector coverage.
That seasonal weakness has historically intensified in midterm-election years, a category that includes 2026. Average September returns in those years fall to negative 1.5%. Average selloffs widen to negative 6.2%. Historically, this pattern has coincided with the rate dynamics RCK Analytics tracked in its blog on why long bond yields are near 2007 levels.
The full report quantifies how much of the recent leveraged ETF deleveraging has already priced in this seasonal risk.
Downside protection stayed unusually inexpensive as of late August 2026, despite the fading support described above. The one-month 25-delta downside options hedge was priced at its cheapest level since December 2024. Meanwhile, the CBOE Volatility Index closed at 14.4. That’s near its second-lowest close since December 2025.
Several dated macroeconomic catalysts fall within this window. These include the Federal Reserve’s September 16, 2026 policy decision. That meeting follows the renewed rate-hike debate RCK Analytics tracked in its recent macroeconomic report on Warsh reopening the rate-hike discussion.
The full report outlines the specific hedge structures and entry points aligned with the mid-October normalization window.
The S&P 500’s 22% rally since March 30, 2026 was fueled by earnings, buybacks, and inflows and all four now fade in the same September window, for calendar reasons, not fundamentals.
Citadel Securities’ Global Market Intelligence team identified a convergence of four fading support systems, buyback blackouts, retail seasonality, pension rebalancing, and record options expiration, all occurring in the same September 2026 window, according to the firm’s September Setup report published August 31, 2026.
Companies enter mandatory blackout periods ahead of quarterly earnings announcements, during which they are legally restricted from repurchasing shares due to insider-information rules. In 2026, this restriction begins accelerating around September 12, according to Citadel Securities’ research.
Not always, but historically more often than any other month. Since 1928, the S&P 500 has closed September lower in 55% of years, with that weakness roughly tripling in magnitude during midterm-election years like 2026, according to Citadel Securities’ historical analysis.
Scott Rubner is Head of Equity and Equity Derivatives Strategy at Citadel Securities. He has recommended reducing market exposure and purchasing inexpensive downside protection while remaining constructive on the longer-term outlook, according to coverage of his August 31, 2026 note.
Share On




 info@rckanalytics.com
 +91 914 533 9262
 +91 (20) 46046669
 M 109 City Avenue, Shankar Kalat Nagar, Wakad, Pimpri-Chinchwad, Pune, Maharashtra, India - 411 057


Services
Sectors
Resources
Company
Copyright © 2026. RCK Analytics - All Rights Reserved.